Image Credit: Valentin Antonucci (Pexels)

Ignoring Bearish Fundamentals May Push Gold to New 2022 Lows
With commodities getting whacked on Aug. 15, gold, silver, and mining stocks materially underperformed the S&P 500. Moreover, with bond and commodities markets more attentive to Fed officials’ hawkish threats, the general stock market is the lone member pricing in a dovish pivot.
However, since hope often leads to disappointment when it’s built on a sloppy foundation, the bulls don’t realize that the Fed’s inflation fight will be one of the most challenging fundamental contests in decades. Therefore, while investors believe that the hard work is done once the Consumer Price Index (CPI) slows, the reality is that the difficult times have only just begun.
For example, the New York Fed released its Empire State Manufacturing Survey on Aug. 15. An excerpt read:
“Business activity declined sharply in New York State, according to firms responding to the August 2022 Empire State Manufacturing Survey. The headline general business conditions index plummeted forty-two points to -31.3. New orders and shipments plunged, and unfilled orders declined. Delivery times held steady for the first time in nearly two years, and inventories edged higher.”
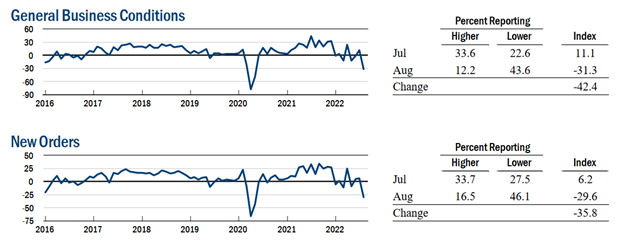
Source: New York Fed
However, while output fell off a cliff, there was “a small increase in employment,” and the prices received index moved higher.
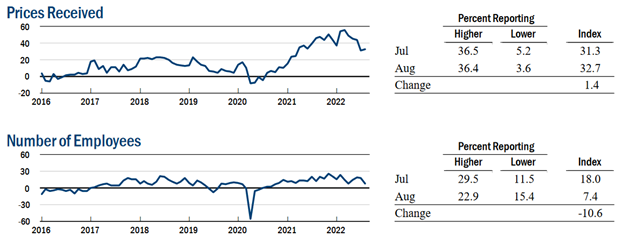
Source: New York Fed
Thus, while the sharp decline in output should have culminated in lower prices, the data highlights just how sticky inflation has become. Furthermore, if prices don’t decline when output craters in New York State, how can investors expect them to fall when S&P 500 companies still have resilient demand?
Furthermore, the report revealed:
“The delivery times index declined to around zero, indicating that delivery times held steady, the first month they have not lengthened in nearly two years.”
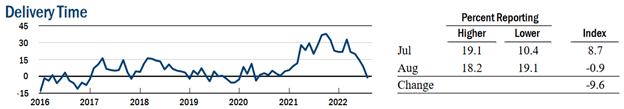
Source: New York Fed
To explain, the Fed and the consensus blamed supply-chain disruptions for the recent bout of inflation. In a nutshell: COVID-19 restrictions suffocated shipping activity, and suppliers didn’t have the inventory to meet demand. Therefore, order backlogs surged, and prices increased as manufacturers bid against one another to obtain the scarce inputs.
However, while the New York Fed’s delivery times index is back near pre-COVID-19 levels, its prices received index is not. As a result, the normalization of supply chains has done little to curb inflation, and investors materially underestimate the challenges that lie ahead.
1970s Here Were Come
While the GDXJ ETF diverged from the S&P 500 on Aug. 15, a sharp decline in the latter would spell immense trouble for the former. Therefore, the general stock market is an important component of our investment thesis. Moreover, while the S&P 500 continued its ascent and the bulls have their sights set on new all-time highs, I warned on Aug. 15 that the fundamental outlook signals the exact opposite. I wrote:
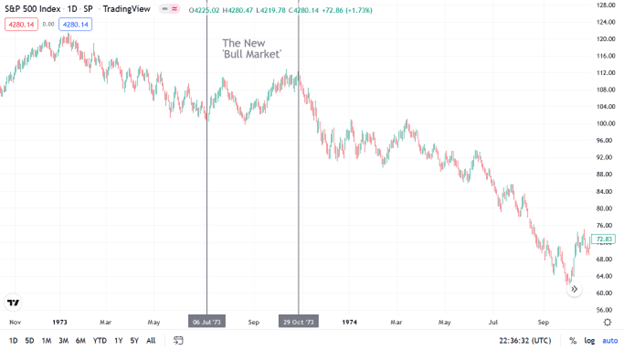
After the FFR peaked in July 1973, the Fed cut interest rates to help support a weakening U.S. economy. However, with inflation still unanchored, the policy mistake led to an even higher FFR during the depths of the recession (the gray area).
Please see below:
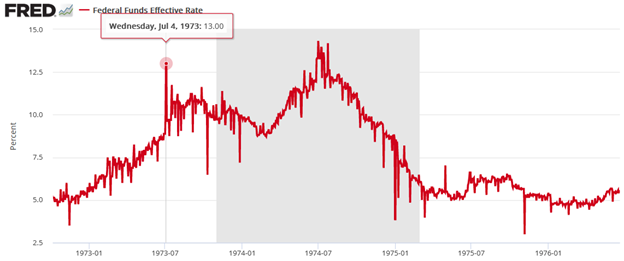
Likewise, the S&P 500 initially celebrated the dovish pivot. With uninformed investors assuming that cutting interest rates was the appropriate response, a sharp rally occurred in July 1973, followed by a sharp pullback and then another rally to a higher high. As a result, don’t you think the crowd was calling for a new bull market from July through October 1973? However, unanchored inflation forced the Fed to reverse course and the S&P 500 fell off a cliff.
Thus, we find ourselves in the same situation. With the consensus underestimating the destructive nature of inflation and overestimating the Fed’s ability, the bulls should suffer a crisis of confidence over the medium term.
Please see below:
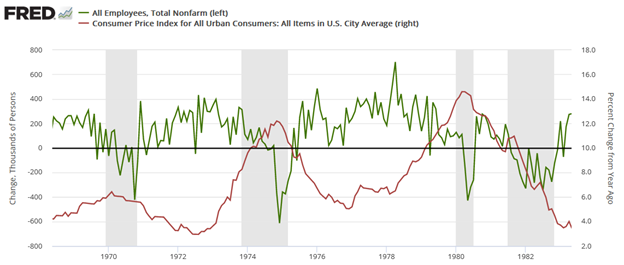
To explain, the red line above tracks the year-over-year (YoY) percentage change in the headline CPI, while the green line above tracks the monthly change in U.S. nonfarm payrolls. For context, the consensus cites near-record job openings and robust payroll growth as evidence for why only a mild recession can occur (if one occurs at all).
However, the chart above highlights how unanchored inflation torpedoed that narrative in the 1970s. If you analyze the shaded gray areas (recessions), notice how the green line remained positive during the early stages of the recessions in 1970, 1974, and 1980. In a nutshell: monthly payroll growth stayed positive during the outset of all three recessions.
However, if you focus your attention on the sharp drops in the green line near the end of the 1970, 1974, and 1980 recessions (negative monthly payrolls prints), you can see that reality re-emerged and the U.S. labor market suffered mightily. Moreover, negative payroll growth was also present during the 1982 recession, but inflation was declining at that time.
As such, it’s important to remember that U.S. nonfarm payrolls growth has been positive in every month except one since May 2020. Furthermore, the U.S. unemployment rate declined to 3.5% in July – its lowest level in ~50 years – and its relationship with the CPI has similar implications.
Please see below:
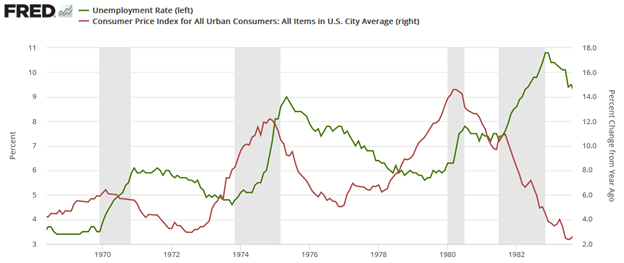
To explain, the red line above tracks the YoY percentage change in the headline CPI, while the green line above tracks the U.S. unemployment rate. As you can see, the 1970, 1974, and 1980 recessions culminated with high inflation and delayed spikes in unemployment. Moreover, while the 1982 recession had a diverging relationship, Paul Volcker made it his mission to eradicate inflation at all costs. Therefore, he understood the severity of the problem and didn’t want a repeat of the outcomes from 1970, 1974, and 1980.
Furthermore, notice how the U.S. unemployment rate always bottoms before a recession? Remember, bear markets don’t end with the U.S. unemployment rate at a ~50-year low; they begin with the metric at a ~50-year low.
To that point, even modern history highlights the uninformed nature of the bulls’ thesis.
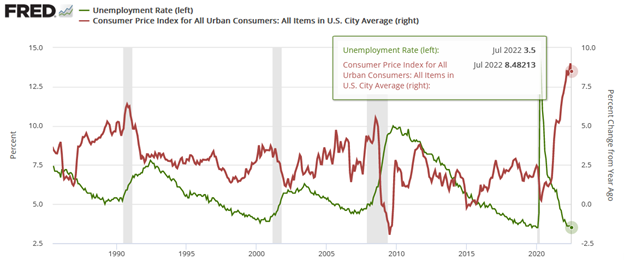
To explain, the recessions near 1990, 2000, and 2008 all began with cycle-low U.S. unemployment rates (the green line) and rising inflation (the red line). In addition, if you analyze the right side of the chart, you can see that the gap between the two is one for the ages. As such, can you guess where this story is headed next?
Finally, while I warned repeatedly that market participants underestimated the demand side of the inflation equation, the consensus still believes that supply-chain issues are the primary driver. However, with unanchored wage inflation poised to keep the pricing pressures uplifted for much longer than investors realize, the Fed will need to push the U.S. federal funds rate (FFR) much higher than 3%.
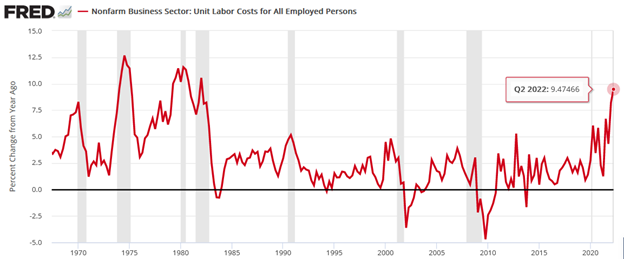
To explain, the red line above tracks the YoY percentage change in U.S. nonfarm unit labor costs from the late 1960s until today. For context, the metric combines wages and productivity to determine the labor costs incurred by U.S. businesses. In a nutshell: when the red line rises, labor is more expensive.
If you analyze the peaks, notice how unanchored labor costs were present during the 1970s and 1980s recessions. Furthermore, even modern history shows that spikes in labor costs occurred before/during the recessions near 1990, 2000, and 2008.
More importantly, the current reading is higher than 1970 and is only surpassed by 1974, 1980, and 1982. Thus, it may seem counterintuitive, but low unemployment, high wages, and high job openings (end-of-cycle metrics) are bearish, not bullish. As a result, the bulls are in la-la land, and the ‘this time is different crowd should suffer mightily when reality re-emerges.
The Bottom Line
While the PMs have rallied recently, they’re still underperforming the S&P 500 and the NASDAQ Composite. Moreover, with the latter ignoring the bearish fundamentals at their own peril, a sharp re-rating of the general stock market should help push gold, silver and mining stocks to new 2022 lows. Likewise, while the bulls want you to believe that all is well on Wall Street, their success hinges on outcomes materializing that haven’t occurred in 50+ years.
In conclusion, the PMs declined on Aug. 15, as most of the commodity complex was crushed. However, with little fear present in today’s financial markets, asset prices are far from their fundamental values. As such, the medium-term outlook is profoundly bearish, and it’s likely only a matter of time before sentiment reflects these realities.
|
About the Author:
Przemyslaw Radomski, CFA (PR) writes and publishes articles as Editor-in-Chief at Sunshine Profits. His work underscores his |
Suggested Content
 Dollar Strength Impacts Commodity Prices, Money Flow, and Worldwide Inflation
|
 Why Natural Gas Opportunities Should Not Always be Lumped in With the Oil Sector
|
 Elon Musk Talks About Tesla Bots, Birth Rates, and Federal Incentives
|
 The More Impactful Fed Moves May Not Make Headline News
|
Stay up to date. Follow us:

|


