
Splits, Ticks, and Stock Value
During August, when Tesla and Apple had both scheduled stock splits, there was a great deal of online discussion around how the value of these two companies would be impacted. It also opened an opportunity for smaller self-directed investors who want more diversification than they could accomplish with share prices between $500 and $2,000 to wave in a few shares. These investors could be more prudent with their exposure to the companies that have been relentless highflyers – favorites that had been out of reach.
Stock splits, at a minimum, serve to place ownership in more hands of more investors. Broad diversity of ownership is desirable for management and boards who prefer to have their ownership less concentrated; it allows them more autonomy to manage. But, what does it do for the stock price for buyers? On the surface, a stock split doesn’t change the fundamentals of the equity in the hands of the public; does it impact shareholder value? Are trading desks enriched or hurt?
Splits Help Stocks Trade Higher
A company stock split changes how their stocks trade. A lower per-share price expands the pool of interested investors; more demand puts upward pressure on price and improves returns. Increased valuations may then feed increased interest driving the performance even higher. As explained by Poe Fratt, Senior Equity Analyst at Noble Capital Markets, “Investors often regard stock splits as positive even though the market capitalization and valuation of the company don’t change. The perception that stock splits are positive probably emanates from the fact that a stock split generally follows a period of strong stock price performance.” Mr. Fratt continued, “While the valuation doesn’t change, there is a belief that a stock price in the $25-$100/share range enhances trading liquidity and makes the stock more attractive to retail investors.” With retail investors now making up more than 25% of stockholders, the inclusion of the “little guy” puts upward pressure on performance.
On average, it shows up in the stock price over the next 12 months. Large-cap stocks outperform the market after a split by 5% during that year. Companies of all sizes outperform after announcing a split by 2.5%. Academic research confirms that liquidity improvements following stock splits reduced average companies’ cost of equity capital by 17.3% or 2.4 percentage-points per-annum. The benefit, on average, is a material boost to both issuers and investors.
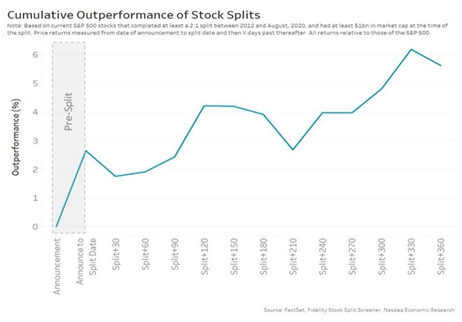
On average, split stocks do outperform the market as soon as the split is announced and even more over the next 12 months.
Trading for Investors Becomes Less Expensive
The cost of transacting in a name is increased by:
- Spread– The percentage difference between bids and offers.
- Liquidity– The average daily value traded, which limits how much value can be easily transacted in a day.
- Volatility– The risks of losses for market makers providing liquidity, low volatility helps to keep spreads tighter.
The Costs of Trading in a name mostly improve.
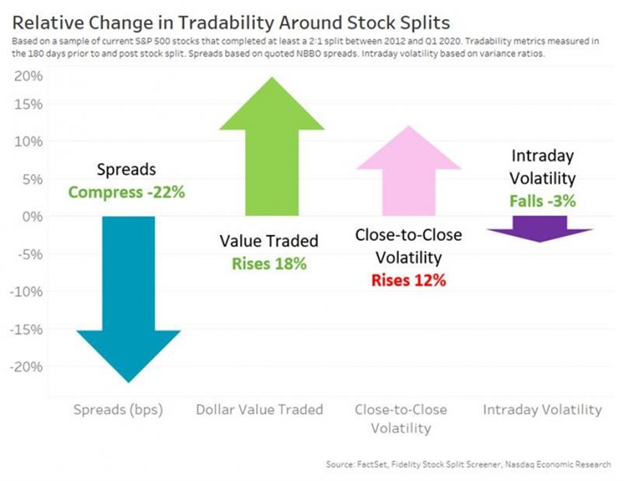
Looking at these metrics for stock-splits from 2012-Q1 2020, they show that on average:
- Spreads- improved by 22%, with 89% of stocks seeing better spreads.
- Liquidity- Value traded increased by 18%, with 70% of stocks seeing better liquidity.
- Intraday Volatility- reduced by 3%, with 66% of stocks seeing lower volatility.
These changes all contribute to lower trading costs. A decline in costs increases returns, which then improve valuations.
Tradability and Stock Price
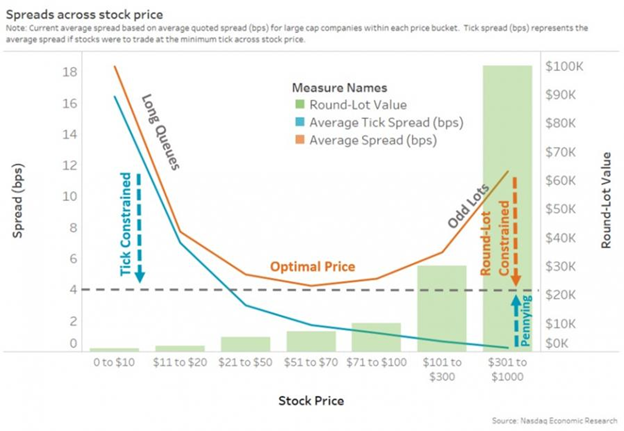
All publicly-traded stocks in the U.S. transact under a very similar set of rules. The rules impact different per-share prices differently. Two rules that impact ease of trading that have recently been softened by technology still have an effect on the overall cost of getting in and out of a position. They are tick sizes and round lots. Low dollar-priced stocks have ticks that make spreads wider on a percent of share price levels. That increases lengths of time waiting to trade and cost to trade. Simply put, their spreads are necessarily wider. Higher dollar-priced stocks have too many ticks and a larger cost round lot. The higher the number of ticks the easier to jump queues. Their spreads are wide because trading is difficult. The high priced round lot makes it expensive to post bids and offers cheaply. There is a sweet spot. Someplace in between is a price level where the tick more closely represents an ideal tradeoff for immediacy of transacting. The “in-between” stocks trade with the lowest spread costs.
Wide spreads deter professional portfolio managers that are measured against benchmarks where slippage is not factored in. A wide spread could deter these investors from larger positions. That reduces interest, and the lower demand weighs on price.
The One-Cent Tick Issue
The smallest increment of U.S. currency is $0.01 or one cent. For example, you can bid $5.01 or $5.02, but not in between. This is part of the problem with tick size versus stock price. The one-cent-tick represents a very different cost for a $5 stock (20bps) than a $500 stock (0.2bps).
For low priced stocks, these spreads can be “expensive” for investors to cross. There needs to be confidence that the potential for an increase is high. This slows down the trading queue and liquidity of the shares.
The one-cent tick also distorts trading in higher-priced stocks. High priced stocks have more tick gradations and more odd-lots, even if the market depth is the same.
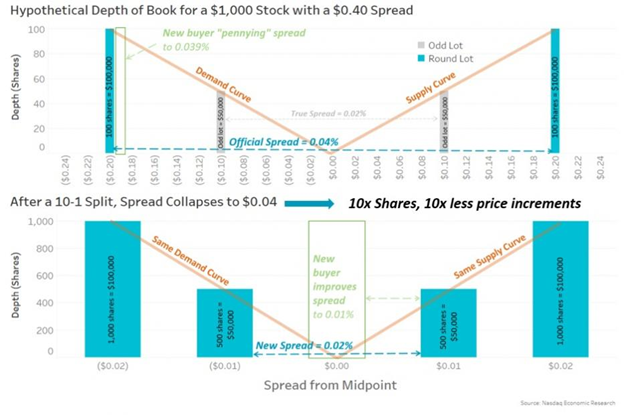
The example above compares a $1,000 and a $100 stock with identical liquidity profiles. The top chart shows that ticks on a $1,000 stock are worth just 0.001%. Even the most liquid companies in the U.S. markets have a spread closer to 0.01%. More increments reduce the cost of new buyers jumping in front of (pennying) buyers already in line. This impacts the initial bidder who may miss being filled. At the same time, it doesn’t really improve the price for those selling.
Round Lot Issues
Using the top chart above, once again, we can see an issue with the convention of trading stocks in increments of 100 (round lot). Historically trading in round lots was designed to reduce paperwork on settlement and to ensure that benchmark spread prices reflected a meaningful trade value. Because of this almost outdated convention, odd lots aren’t treated the same way as round lots. The prices quoted to the public are round lot prices. They set the official spread that institutional investors use to calculate trading costs, and they are “protected,” which means traders cannot skip over them to trade elsewhere (including off-exchange).
Round lots can widen spreads. The chart above shows the value of a round lot increases as prices increase. According to Nasdaq research (the V-shape above) is the same regardless of tick size. However, when the stock in the upper chart is split 10:1, the 50-share ($50,000) odd lots become round lots, this instantly adds size to the official quote and cuts the spread for the $100 stock in the lower chart in half. So, with larger increments and smaller round lots, an investor looking to outbid those in the queue now has a more difficult time with the tighter spread.
Regulators are Aware of the High Price Issues
Investors have weighed in about issues trading high priced stocks and are looking to alleviate some of the issues. The SIP committee, responsible the consolidated tape, has proposed adding odd lots to the tape. That fixes the round lot issue but may create a best execution issue if very few shares are indicating the benchmark price. The SEC has proposed changing round lot sizes. This partially helps issues in the round lot quagmire, but while trying to avoid the best execution measurement issues, it removes some investor protections by allowing trade throughs. In Europe, regulators have eliminated round lots and also changed tick sizes.
Stocks are Pricier Than Before
From 1930 until as recently as 2007 nominal prices of common stocks have remained constant at around $30-$40 per share as a result of firms splitting their stocks. Stock splits were so normal that prices held in a consistent range. Before 2007 it was rare for the S&P500 to have more than a few stocks over $100. Now there are more than 100 (approx. a quarter of the index).
Number of Stock Splits by S&P 500 Companies
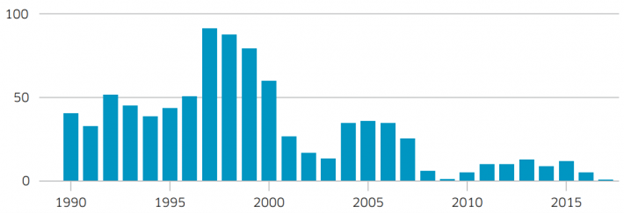
It would be easier for traders if stocks traded more uniformly with roughly the same prices. Instead, fewer stock splits have allowed higher stock prices since the financial collapse of 2008. This is a relatively new characteristic of the market.
Some of the blame is placed on Reg NMS which were trading rules instituted in 2007 to help make markets more readily electronic and interconnected. The rule included decimalization (not fractions), which cleared the way for low one-cent ticks. Now, a significant number of stocks have reached well past the level where they are constrained by a one-cent tick. The result is a larger proportion of trading is happening away from listed prices. Price discovery may also be dampened by the lack of visibility widening spreads.
Take-Away
Stock splits fundamentally improve tradability and that boosts share price. Tradability and its connection to trading costs help clear the way for these better valuations. The market’s positive reaction to a stock split announcement confirms that traders know costs matter to longer-term price. It also, according to Mark Reichmann, Senior Equity Analyst at Noble Capital Markets “… signals to the market that management is confident in its operations.”
Statistics demonstrate that many IPOs get priced around $20 to $40 per share. This shows that bankers taking companies public intentionally choose an effective stock price level. But the sweet-spot, where ticks are neither too wide or too narrow, is different for every company. Regulators are beginning to address investor concerns as stock splits have become far less common over the past dozen years. Some of the issues of higher prices are helped by the new trend of brokers offering fractional shares. This ability compounds many other issues–but that’s a topic for another article.
Paul Hoffman
Managing Editor, Channelchek
Suggested Reading:
Why do Small-Cap Stocks Outperform After a Major Election
Investment Barriers Once
Seen as Insurmountable are Falling Fast
Trading Technology Continues to Level the Playing Field for Investors
 Each event in our popular Virtual Road Shows Series has maximum capacity of 100 investors online. To take part, listen to and perhaps get your questions answered, see which virtual investor meeting intrigues you here.
Sources:
Three Charts That Show a Dramatic Drop in Stock Splits
Three Compelling Reasons for Companies to Split Stocks
Why Intelligent Ticks Make Sense
Looking for the perfect Stock Price


