Why Investors Monitor the Yield Curve and Yield Curve Changes
The difference between interest rates being paid for all available maturities of the same credit quality bonds and notes forms the yield curve. When these points are plotted on a line graph, the shape of the line is the “curve.” The US Treasury Yield curve is by far the most discussed. However, there are yield curves for corporate bonds, mortgage securities, municipal bonds, and other interest rate products. But these are often quoted as an interest rate spread to the US Treasury yield curve.
Data: US
Department of Treasury
The shape of a yield curve—where the Y-axis is interest rates, and the X-axis shows increasing time to maturity— can take on different shapes. The most common are upward sloping or “normal yield curve,”
downward sloping, or “inverted yield curve,” and flat.
The significance of these shapes has historically been used by
stock
market investors as a gauge of future expectations of economic activity and inflation. A normal yield curve indicates expectations of a growing economy, and the risk of rates being pushed up over time. A downward-sloping yield curve indicates expectations of a contracting economy or one where interest rates may need to be lowered in the future. A flat yield curve typically indicates expectations of a stagnant economy. This is also viewed as negative for stocks because equity investors like to see economic growth.
Shifts in Curve
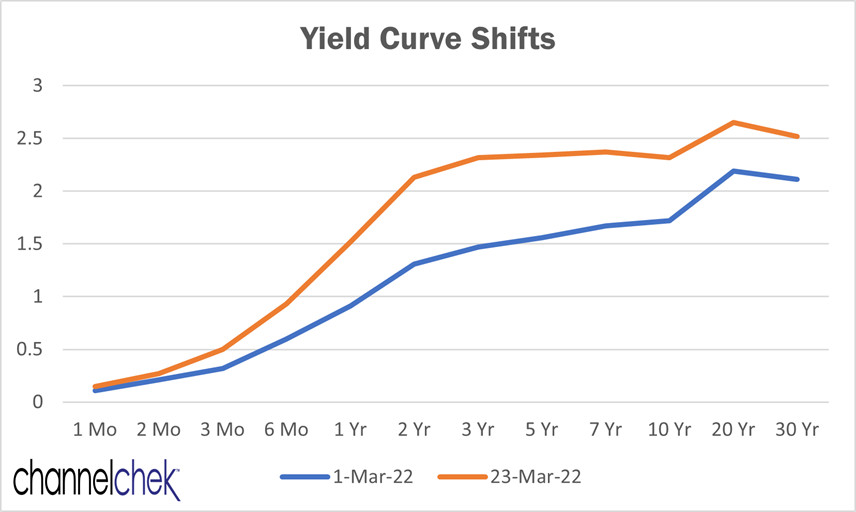
Changes in rates from one period to the next will cause changes in the shape or steepness of the curve. The graph above shows the shift in yields from March 1, 2022 to March 23, 2022 – the Fed
tightened overnight rates by 25 bp on March 16, then on March 21, indicated a need to further increase rates. This caused a steepening.
Shifts in the curve indicate whether bond investor sentiment for higher rates is increasing or decreasing. Historically this has been based on an accelerating or decelerating economy and a changed inflation forecast. Bond market investors want to be compensated for inflation. In recent years the US Federal Reserve has taken steps that include buying bonds to adjust longer rates or add liquidity to the market. This impacts the usefulness of the curve, so investors ought to take these actions into account. There is now increased importance of Fed
announcements surrounding these purchase activities (sometimes referred to as yield-curve-control, quantitative easing, or QE). A reduction in Fed purchases (
tapering) will tend to push longer-term rates up as the Fed has been a significant buyer of the maturity range they targeted with QE.
You May Also Be Interested In:
 What is Fed Tightening
|
 Merger of a SPAC
|

Stay up to date. Follow us:

|


