
Monday, October 17, 2022
Michael Kupinski, Director of Research, Noble Capital Markets, Inc.
Patrick McCann, Research Associate, Noble Capital Markets, Inc.
Jacob Mutchler, Research Associate, Noble Capital Markets, Inc.
Refer to the bottom of the report for important disclosures
Overview. Develop a shopping list. This report focuses on the looming economic recession and how investors should position portfolios for the prospect of an economic recovery. But, a more important theme of this report is for investors not to look for the past leaders in the industry as the best way to play a rebound. In this report, we look beyond a rebound play and focus on our favorite growth plays.
Digital Media: The smaller beat the goliaths. Two of our current favorites in the AdTech and MarTech industries performed better than most of its respective peers in the quarter. Can the momentum continue?
Television Broadcasting: Will political carry the quarter? With signs of weakening National advertising, broadcasters are looking forward toward Q4 Political as an offset. Political advertising, however, is not usually evenly spent across all markets. There may be winners and some losers.
Radio Broadcasting: Polishing its tarnished image. One of the epic fails of the radio industry has been Audacy, once one of the leadership companies of the industry. The AUD shares are down a staggering 95% from highs in March 2021. New industry leaders are emerging and they are not focused on radio. We highlight a few of our current favorites.
Publishing: Once a leader, now a loser. It is hard to believe that Gannett was once a $90 stock and held a record for one of the longest strings of quarterly earnings gains in the S&P 500 Index. The shares are down 80% from year earlier highs to near $1.37. We believe that investors should take a look at a company that has developed into an impressive Digital Media publisher.
Overview
Develop A Shopping List
The best time to buy stocks is typically in the midst of an economic recession. Investors begin to look beyond the economic weakness and begin positioning portfolios for an economic rebound. The hard part is determining when the economy is in the middle of the downturn. It appears by all standard definitions of an economic downturn that the U.S. is in an economic recession. But, how long will a downturn last? Should investors try to be cute to predict the midpoint of the downturn?
Many economic pundits paint the current state of the economy against the canvas of the 1970s, a period of high inflation and low economic growth. There are many similarities. The Federal Reserve in the early 70s was willing to provide cheap money to fuel the economy, without much concern about inflation. In the second half of the 70s, the economy was rocked by fuel supply shortages and high inflation. During the Covid pandemic, both fiscal and monetary policy was designed to provide liquidity and to make sure that people were able to pay their bills during the economic lockdowns. This had the affect of increasing personal income, even though GDP declined 31.4% in 2020. As the economy reopened, there was significant demand for goods and services, some of which were in short supply because of the previous and recurring economic lock downs. Simplistically, this fueled inflation, high demand with a consumer that had disposable income and limited supply.
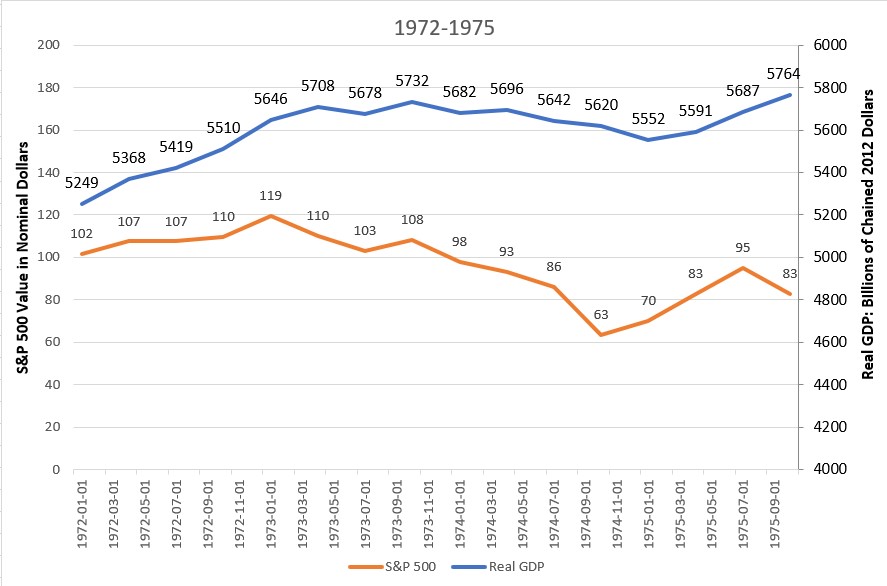
As Figure #1 Early 1970s chart illustrates, the US economy grew 9.8%, as measured by real GDP, from January 1972 to September 1975. Notably, the stock market, as measured by the S&P 500 Index, declined a significant 18.6%. This was a period marked by rising inflation due to government spending. The inflation rate, as measured by the US Bureau of Labor Statistics, was a reasonable 3.3% in 1972, but increased to 11.1% in 1974 and then moderated slightly to 9.1% in 1975. The inflation rate remained above 5% for the following 3 years.
Figure #1 Early 1970s
Source: US Bureau of Economic Analysis and Yahoo Finance.
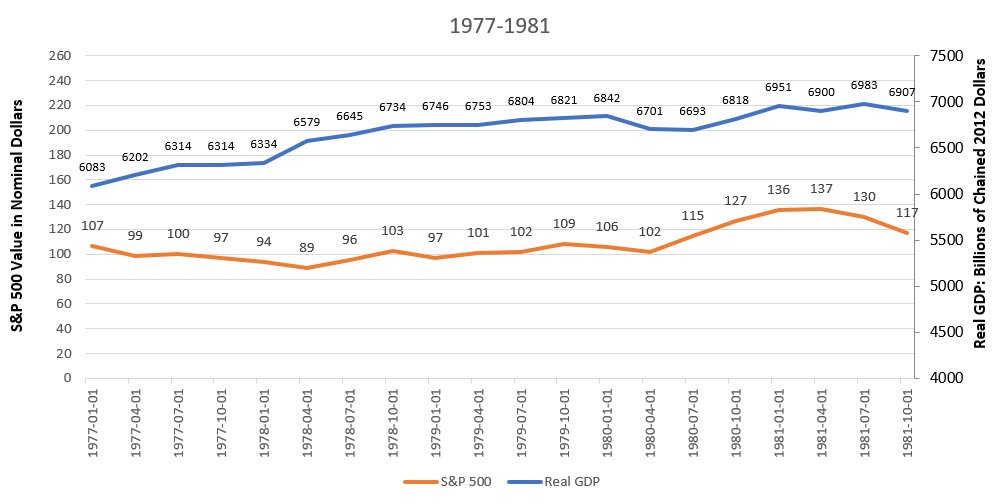
Given the current state of rising energy prices, many pundits paint the current US economic plight similar to the period of fuel shortages of the late 1970s. As Figure #2 Late 1970s illustrates, the US economy, as measured by real GDP, grew 13.5% from January 1977 to October 1981, an average of slightly more than 3% per year. Notably, inflation increased significantly, from 6.5% in 1977 to 11.3% in 1979, followed by 13.5% in 1980, and 10.3% in 1981. The stock market, as measured by the S&P 500 Index, did not react well, up 9.3% from January 1977 to October 1981, an average of 2.3% growth.
Figure #2 Late 1970s
Source: US Bureau of Economic Analysis and Yahoo Finance.
So, where are we now? In the present, the Covid induced government spending and stimulus related fiscal policy, large spending on the Ukraine war, and a Fed unwilling to rein in early signs of inflation has put the US in a dire economic position. Certainly, supply chain shortages contributed to the current rise in inflation, as well. The Fed now appears to have religion on inflation and is aggressively raising interest rates. The Fed indicated that it is willing to create economic pain to arrest inflationary pressures. Most certainly this will cause additional economic weakness. The stock market in the near to intermediate term will need to digest the likelihood of weakening corporate profits, as well. Furthermore, as it relates to the equity markets, other investment classes, such as bonds, may become more appealing, taking demand from the stock market.
We believe that arresting inflation would set a favorable trajectory for the stock market, as investors position for the prospect of an economic recovery. To some degree, the 24.4% drop in the stock market, as measured by the S&P 500 index, from January 2022 to near current levels, anticipate some of the headwinds for investors described earlier in this report, including weakening corporate profits, the prospect of a further weakened US, and, even global economy, a move toward other investment classes, and stubborn inflation. What is different this time is that the Fed now appears to be aggressively tackling inflation. As such, the 47% drop in the stock market from highs in 1973 to the low in 1974 may not be a prelude to the current environment. It was a different Fed and it took different actions.
We encourage a different approach than trying to time the market. Our advice is for investors to develop a shopping list and begin accumulating. But, be selective.
We believe that the leadership companies of the past economic downturns are not likely to be the best positioned for the looming economic downturn or the recovery. Many of the larger cap names in each sector have fallen on hard times. This is discussed more fully in the following sector reports. Those that appear to be well positioned are companies that have diversified revenue streams, transitioned to faster growth digital businesses, and pared down debt. We encourage investors to focus on these companies given the prospect of faster revenue and cash flow growth coming out of the possible recession. Some of our current favorites include Entravision, Townsquare Media, Salem Media, Harte Hanks, Direct Digital, and Lee Enterprises. These companies are discussed in the following sector summaries.
Internet & Digital Media
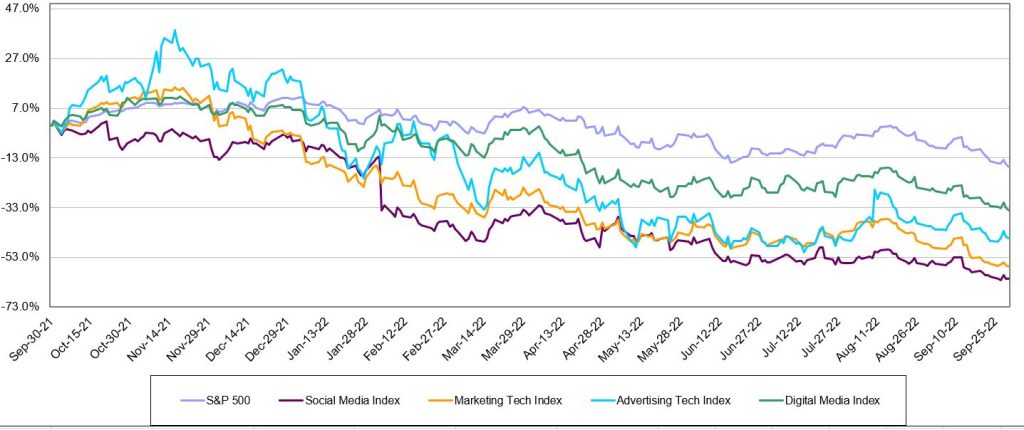
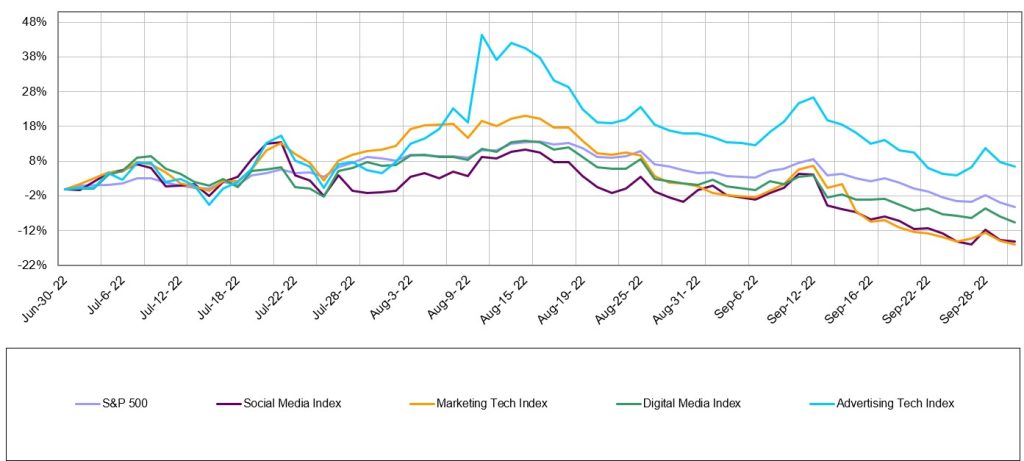
Internet and Digital Media stocks declined for the fourth consecutive quarter in a row, as Figure #3 Internet & Digital Media Stock Performance illustrates. It wasn’t all bad, as Noble’s Ad Tech Index outperformed the general market, as measured by the S&P 500 Index, up +7%. Comparatively, the S&P 500 Index decreased by 5%. Figure #4 Internet & Digital Media Q3 Performance reflects the outperformance of the AdTech sector. AdTech also materially outperformed Noble’s other Internet & Digital Media subsectors, including Noble’s Digital Media Index (-10%); Social Media Index (-15%) and MarTech Index (-16%). Notably, some of our closely followed companies significantly outperformed the respective peer group and outperformed the general market, discussed later in this report.
Figure #3 Internet & Digital Media LTM Stock Performance
Source: Capital IQ
Figure #4 Internet & Digital Media Q3 Stock Performance
Source: Capital IQ
Marketing Technology
Harte Hanks shines in MarTech
The worst performing sector was the MarTech sector, which is also the least profitable sector. This likely explains the sector’s underperformance. Only 4 of the 24 companies we monitor in this sector generate positive EBITDA, and investors migrated away from unprofitable growth stocks towards more profitable companies or defensive sectors that might withstand a recession better. Investors would clearly like to see companies in this sector accelerate their path to profitability, and most companies in the sector are responding accordingly. To be fair, some of the companies that aren’t EBITDA positive do generate positive cash flow from operations, which is a quirk of SaaS software accounting. Of the two dozen companies in this sector, the only stock that was up during the quarter was Harte-Hanks (HHS), whose shares increased by 68%. HHS continues to generate improved operating results while lowering its debt and pension obligations.
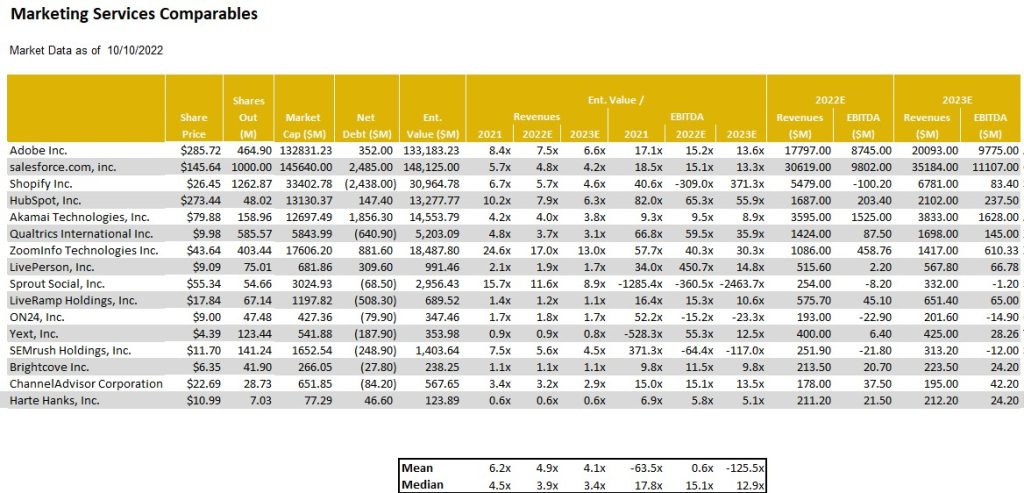
MarTech stocks have also been victims of their own success. Earlier this year the group traded at average revenue and EBITDA multiples of 8.5x and 70.8x, respectively. Today the same group trades at average revenue and EBITDA multiples of 4.5x and 30.1x, respectively. Stocks like Shopify (SHOP), and Hubspot (HUBS) entered the year trading at 22.2x and 14.7x 2022E revenues, respectively, and now trade at 5.3x, and 7.7x, respectively. Some of this appears to be a Covid-related hangover: when Covid hit, retail companies needed to emphasize their online channels, and companies like Shopify benefited. As consumers return to stores, growth has moderated. Shopify aside, the broader message investors seem to be sending is that recurring revenues are great, but not if they are paired with EBITDA losses at a time when economy appears to be heading into a potential recession.
As Figure #5 Marketing Tech Comparables illustrate, the shares of Harte Hanks is among the cheapest in the sector, currently trading at 5.1 times Enterprise Value to our 2023 adj. EBITDA estimate. We believe that the modest stock valuation relative to peers, currently trading on average at 12.9 times, illustrates the head room for the stock in spite of the 68% move in the latest quarter. The shares of HHS continue to be among our favorites in the sector.
Figure #5 Marketing Tech Comparables
Source: Eikon, Company filings and Nobles estimates
Advertising Technology
Direct Digital exceeds peers
Noble’s AdTech Index was the worst performing Index of the group in the second quarter when it was down 39%. As such, it was nice to see a better performance in the third quarter. In addition, Noble Indices are market cap weighted, and we attribute the relative strength of the Ad Tech Index to the performance of The Trade Desk (TTD), the Ad Tech sectors largest market cap company, whose shares were up 42% during the quarter. Other notable performers were Digital Media Solutions (DMS; +73%) which announced a deal to be taken private, and Zeta Global (ZETA; +46%), whose 2Q results significantly exceeded guidance. Despite the relative strength of the sector, returns were not broad-based: only 9 of the 23 stocks in the Ad Tech sector were up during the quarter.
One of our closely followed companies, Direct Digital (DRCT) had a strong performance, up 75% in the quarter. The company’s second quarter exceeded expectations and the company raised full year 2022 revenue and cash flow guidance by a significant 40%. The company appears to be bucking the downward trend in National advertising, which is reflected in its peer group quarterly performance.
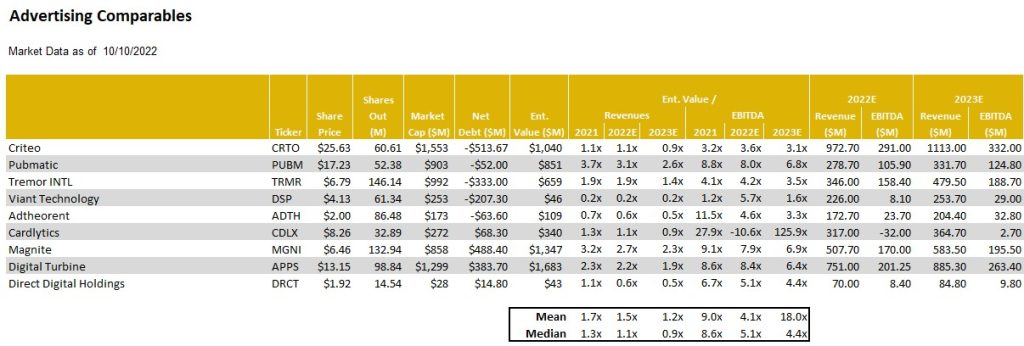
As Figure #6 Advertising Tech Comparables illustrate, Direct Digital Holdings is trading near the averages in terms of Enterprise Value to the 2023 adj. EBITDA estimate. We would note that this valuation is low considering that the company is outperforming its peers. As such, we believe that there is a valuation gap and we continue to view DRCT shares as among our favorites.
Figure #6 Advertising Tech Comparables
Source: Eikon, Company filings and Nobles estimates
Traditional Media
Downward trends, but some bright spots
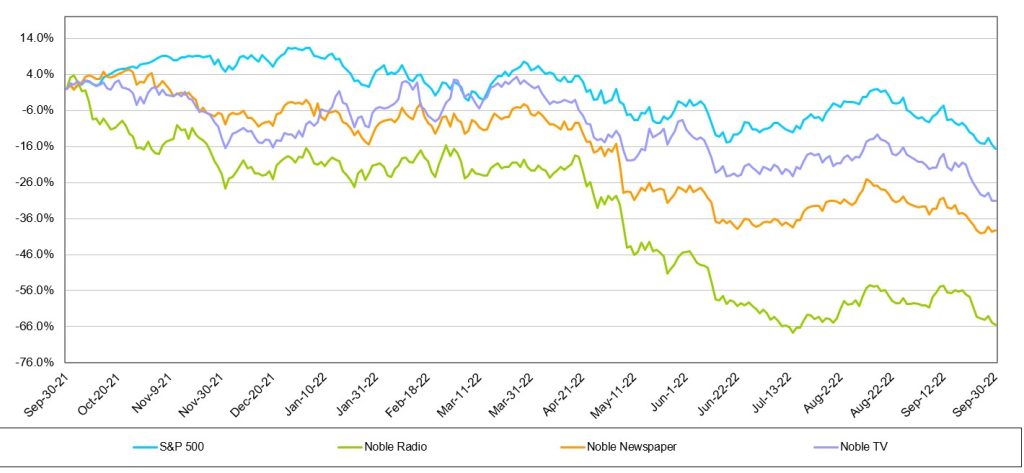
The Traditional Media stocks have had tough sledding this year. As Figure #7 Traditional Media LTM Stock Performance illustrates, all of Noble’s Traditional Media Indices have declined over the past 12 months and each have underperformed the general market. The downward spiral seemed to have moderated somewhat in the third quarter.
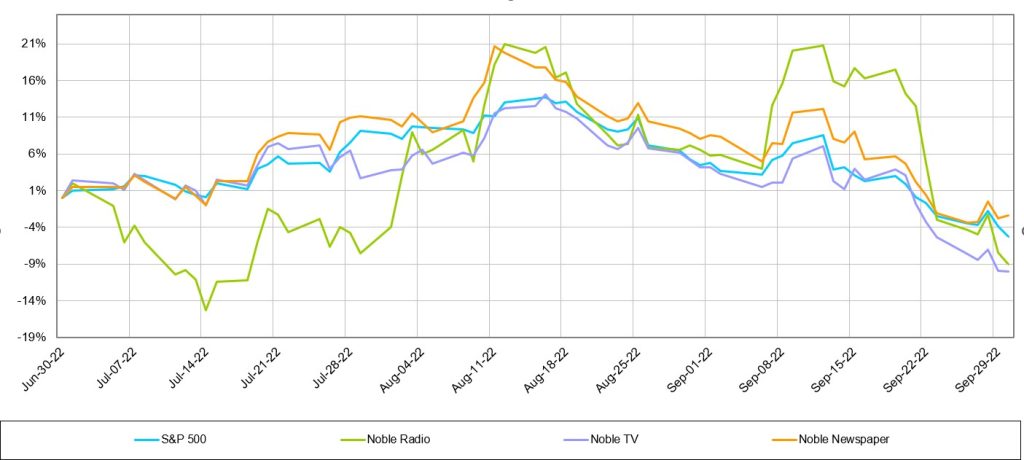
Notably, during the third quarter, many of the stocks had a very nice bounce before resuming a downward trend, as Figure #8 Traditional Media Q3 Stock Performance illustrates. At one point in the latest quarter, stocks were up as high as 30% from the second quarter end. It is important to note that only the Publishing stocks outperformed the general market in the latest quarter. A description of the traditional media sectors follow with our favorite picks for the upcoming quarter and year.
Figure #7 Traditional Media LTM Stock Performance
Source: Capital IQ
Figure #8 Traditional Media Q3 Stock Performance
Source: Capital IQ
Television Broadcasting
Noble’s TV Index dropped 10.1% in the third quarter, underperforming the broader market (-5.3%), illustrated in Figure #8 Traditional Media Q3 Stock Performance. As we indicated in our previous quarterly report, we believe that there would be a trading opportunity in the media stocks. The latest quarter stock performance indicated that. Many of the TV stocks had a strong performance from the end of the second quarter (June 30) to highs achieved in August. Many of the TV stocks increased a strong 25% on average. It is instructive to know that E.W. Scripps had the largest advance from June 30 lows, up 31% to highs achieved August 16. When the industry is in favor, the shares of E.W. Scripps tends to outperform its industry peers. The shares of Entravision (EVC) were the next best performing within the quarter, up 30%, before trading lower and ending down 12%.
The TV stocks were challenged by macro economic pressures such as inflation, rising cost of borrowing, and a Fed determined to curb inflation by slowing the economy. In the end, interest rate increases by the Fed curbed enthusiasm for TV stocks and the Noble TV Index ended the third quarter down.
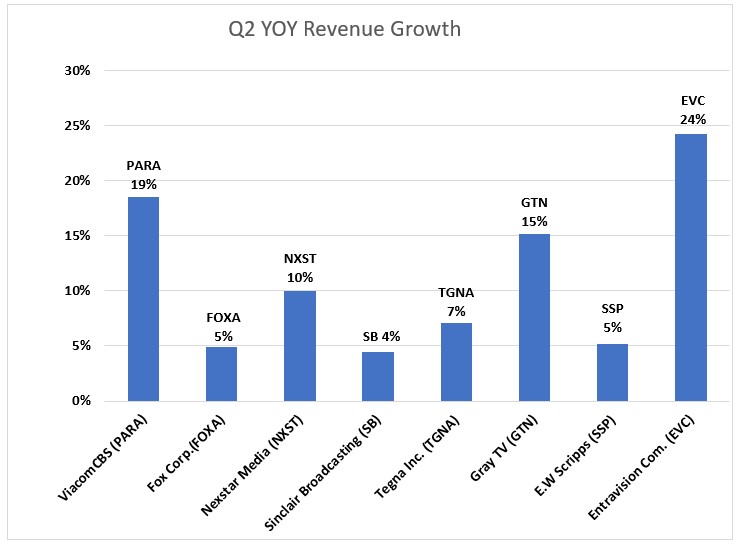
As Figure #9 Q2 YOY Revenue Growth illustrates, the average television company reported 11.1% revenue growth in the latest quarter. Most broadcasters were very optimistic about Political advertising, with some raising forecasts to be near the levels of the Presidential election, a highwater mark. We would note that Entravision had the highest revenue performance in the quarter, up 24%, as the company continues to benefit from its transition toward faster growth Digital, which now accounts for over 80% of its total company revenues.
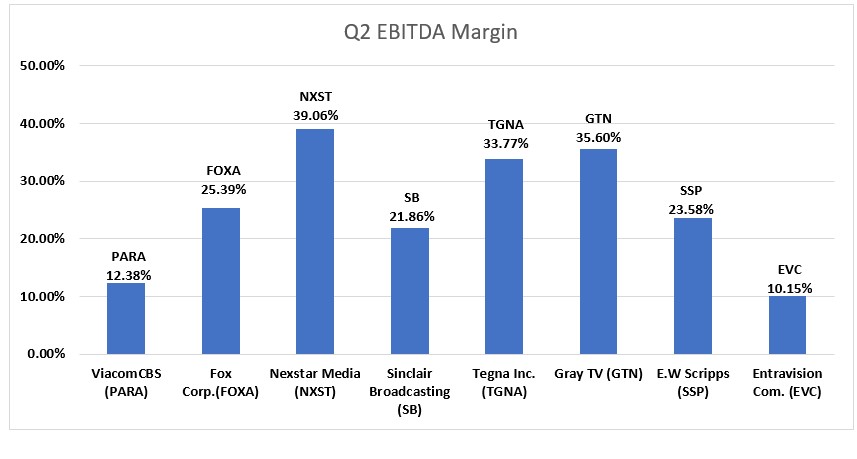
Industry adj. EBITDA margins were healthy, as Figure #10 Q2 EBITDA margins illustrate, with the average margin for the industry at 25.5%. It is notable to mention that Entravision margins appear to be significantly below that of the industry at 10.1%. Its Digital business is a rep business, and, as such, the company reports revenues on a net basis and not gross revenues. While a rep business tends to be a lower margin business, the reporting of rep revenues gives the appearance of very low margins. The company is in a strong cash flow and free cash flow position.
Most companies will be reporting third quarter financial results in the first two weeks in November. We believe that the third quarter will reflect an influx of Political advertising, even though the lion’s share of the Political advertising likely will fall in the fourth quarter. Consequently, we believe that the third quarter revenue growth will be better than the second quarter, showing some acceleration. With signs of weakening National advertising, and a likely weakening Local advertising environment in some larger markets, broadcasters are looking forward toward Q4 Political as an offset. Many broadcasters indicated that Political advertising may be at record levels in 2022, even higher than the Presidential election year of 2020. Political advertising, however, is not usually evenly spent across all markets. As such, there may be winners and some disappointment.
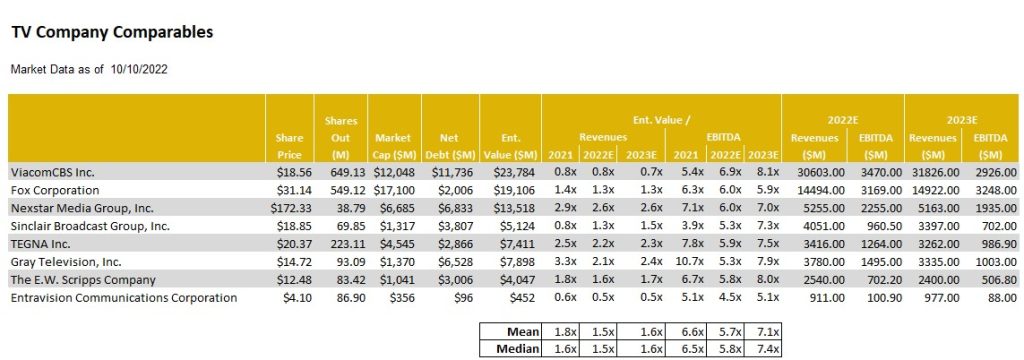
Investors are not encouraged to buy a Television broadcaster on the basis of the upcoming fourth quarter Political advertising influx. There are broader issues at play, like cord cutting, slowing Retransmission revenue growth, and the prospect for a weakening economy. We believe broadcasters with minimal emphasis on National advertising, a larger focus on small to medium size markets and local advertising, are best positioned to weather an economic downturn. We also like companies that do not have high debt leverage. In addition, we like diversified companies that can benefit from cord cutting, like E.W. Scripps, or have diversified revenue streams and large fast growing digital businesses, like Entravision. As Figure #11 TV Industry Comparables illustrate, the shares of Entravision are among the cheapest in the industry and the EVC shares leads our favorites in the industry.
Figure #9 TV Industry Q2 YoY Revenue Growth
Source: Eikon and Company filings
Figure #10 TV Industry Q2 EBITDA Margins
Source: Eikon and Company filings
Figure #11 TV Industry Comparables
Source: Eikon, Company filings and Nobles estimates
Radio Broadcasting
Polishing its tarnished image
One of the epic fails of the radio industry has been Audacy, once one of the leadership companies in the industry. The AUD shares are down a staggering 95% from highs in March 2021. The poor stock performance reflects the poor revenue and cash flow performance and high debt levels at the company. Recently, the company announced that it plans to sell some of its prized assets, including its podcasting business, Cadence 13, in an effort to more aggressively pare down debt. While Audacy struggles, there are emerging leaders in the industry, many that are not focused on its radio business, discussed later in this report.
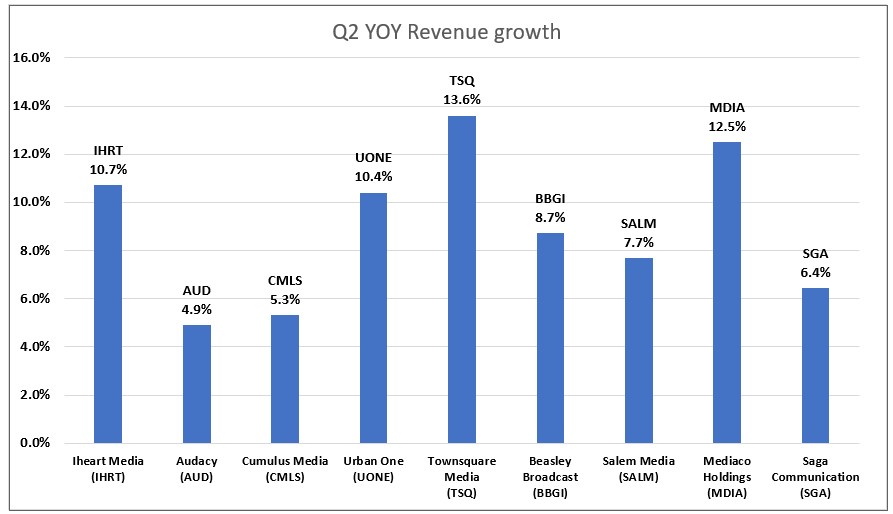
As Figure #12 Radio Industry Q2 YoY Revenue Growth chart illustrates, the average radio revenue grew 8.9%. Companies that were at the top of the list of revenue growth had diversified revenue streams. Townsquare Media was the best performer, with Q2 revenue growth of 13.6%. We believe that Townsquare also benefits from significantly lower National advertising and concentration on less cyclical larger markets. Other diversified companies that performed better than the lower growth companies in the group were Salem Media and Beasley Broadcasting. Salem Media has diversified into content creation and digital media and Beasley recently accelerated its push into Digital Media. Separately, Beasley recently announced a station swap with Audacy, which will enhance its position with its four existing stations in Las Vegas.
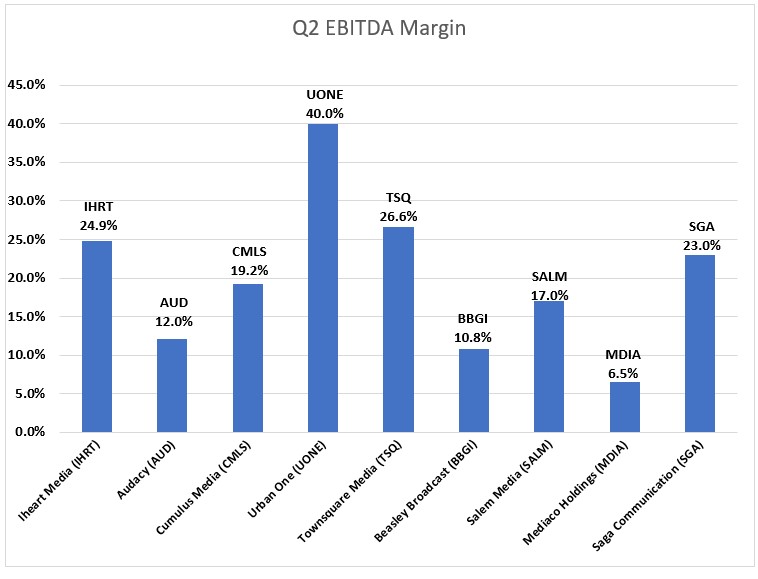
On the margin front, Townsquare Media also was among the leaders in the industry. Notably, Townsquare Media’s digital business carries margins similar to its Radio businesses, near 30%. As such, its investments in Digital Media are not depressing its total company margins. As Figure #13 Q2 Radio Industry EBITDA Margins illustrate, Townsquare’s Q2 adj. EBITDA margins were 26.6%, well above that of the larger industry peers like iHeart (24.9%), Cumulus Media (19.2%), and Audacy (12.0%).
In looking forward toward the upcoming third quarter results, which will be released in coming weeks, we believe that the effects of rising inflation and weakening economy will start to show. Many of the larger broadcasters which focus on larger markets, have national network business, may disappoint. In addition, we believe that there will be spotty Political advertising performances. In our view, the resulting potential weakness in the stocks may create an opportunity to more aggressively accumulate or establish positions.
Radio stocks largely mirrored the performance of the TV industry, falling 9% in the third quarter, illustrated above, in Figure #8 Traditional Media Q3 Stock Performance. Last quarter we pointed out that large industry players such as Audacy and iHeart had an outsized negative impact on the market cap-weighted index. This was due to the stocks being downgraded by a Wal Street firm on the basis of high leverage in a time of recession.
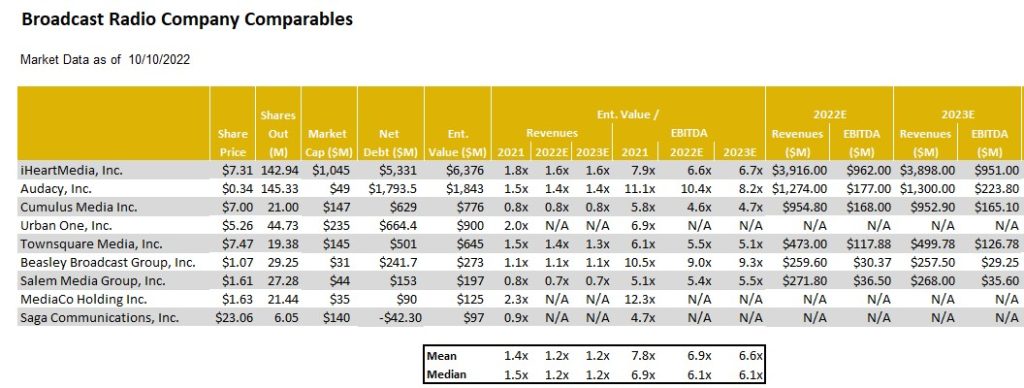
However, there are several broadcasters in the Radio industry with improving leverage profiles. Furthermore, we believe that in a time when traditional radio companies are making a transition to more digitally based revenue sources, investors would do well to differentiate among them on that basis as well. In our view, certain companies are ahead of peers in the digital transformation and are better shielded from certain fundamental headwinds that have traditionally plagued radio broadcasters in prior recessions. We encourage investors to focus on Townsquare Media (TSQ), Salem Media (SALM), and Beasley Broadcasting (BBGI). As Figure #14 Radio Industry Comparables highlights, Townsquare Media, Cumulus Media, and Salem Media are among the cheapest in the group.
Figure #12 Radio Industry Q2 YoY Revenue Growth
Source: Eikon and Company filings
Figure #13 Q2 Radio Industry EBITDA Margins
Source: Eikon and Company filings
Figure #14 Radio Industry Comparables
Source: Eikon, Company filings and Nobles estimates
Publishing
Once a leader, now a loser
It is hard to believe that Gannett was once a $90 stock and held a record for one of the longest strings of quarterly earnings gains in the S&P 500 Index. The shares are down 80% from year earlier highs to near $1.37. For some anti newspaper investors, this is a “told you so” moment. But, this view missed notable exceptions, like the New York Times, which seemed to transition more quickly toward Digital revenues. There are publishers that are set apart from the weak trends at Gannett and are on a favorable trajectory toward a Digital future. As such, we believe that investors should not throw the baby out with the bathwater or avoid the industry. There are gems here, which is discussed later in this report.
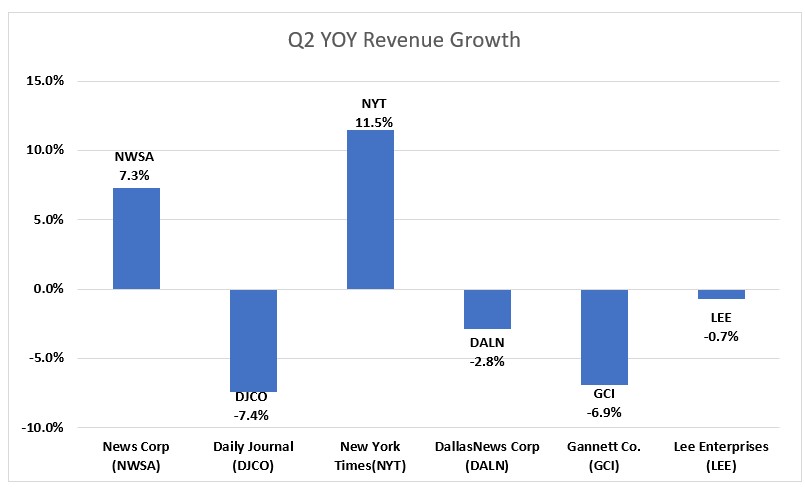
There were sizable differences in the financial performance of the companies in the publishing group. As Figure #15 Publishing Industry Q2 YoY Revenue Performance chart illustrates, Q2 publishing revenue declined on average 1.5%. The notable exceptions to this performance was The New York Times, up 11.5%, News Corp, up 7.3%, and Lee Enterprises, down a modest 0.7%. The improved performance into the ranks of the leaders in the industry is quite notable. Lee’s digital subscriptions currently lead the industry. The company has exceeded all of its peers in terms of digital subscription growth in the past 11 consecutive quarters. Furthermore, over 50% of its advertising is derived from digital. Currently, roughly 30% of the company total revenues are derived from Digital, still short of the 55% at The New York Times, but closing the gap.
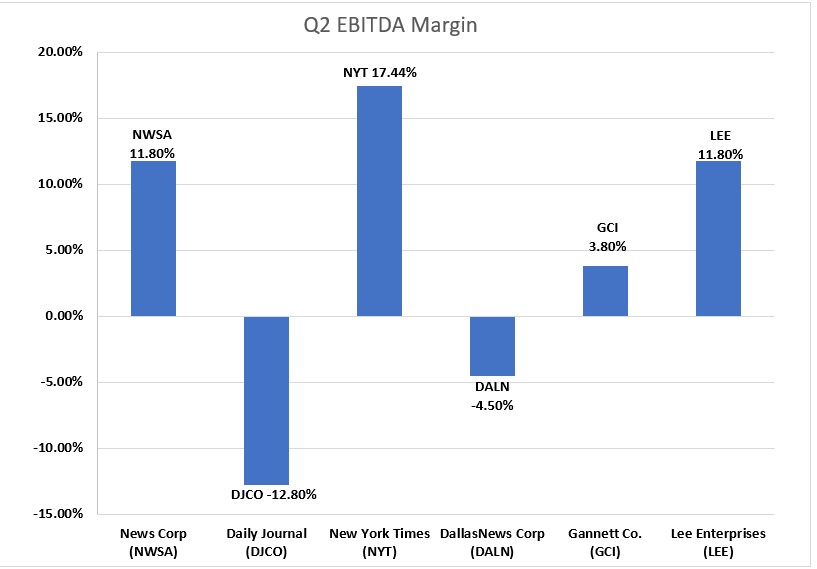
Not only is Lee performing well on the Digital revenue front, it has industry leading margins. As Figure #16 Q2 Publishing Industry EBITDA Margins illustrates, Lee’s Q2 EBITDA margins were 11.8%, in line with News Corp and second only to the New York Times at 17.4%. We believe that margins should improve over time as the company continues to migrate toward a higher digital margin business model.
Illustrated above in Figure #8 Traditional Media Q3 Stock Performance is Noble’s Publishing Index, which decreased a modest 2.4% in the quarter, outperforming the S&P (-5.3%). The relatively favorable performance of the index was primarily due to its largest constituents, News Corp. and The New York Times, which rebounded from -29.7% and -39.1%, respectively in Q2, to -3% and +3%, respectively, in Q3. The average percentage change of the stocks in the industry was -16.2%, more in line with Traditional Media as a whole. One of the poor performing stocks in the index for the quarter was Gannett (GCI) which declined 47%. It was recently reported that the company implemented austerity measures included unpaid leave and voluntary layoffs. In the case of Lee Enterprises, the shares were down a much more modest 7%, more in line with the general market. In our view, the company is expected to report favorable third quarter results and the shares are undervalued.
As Figure #17 Publishing Industry Comparables chart illustrates, the LEE shares trade at an average industry multiple of 5.8 times Enterprise Value to our 2023 adj. EBITDA estimate. Notably, the company is closing the gap with its Digital Media revenue contribution to that of New York Times, which is currently trading at an estimated 14.5 times EV to 2023 adj. EBITDA. We believe that the valuation gap with the New York Times should close as well. In recent Lee Enterprise news, a buyout specialist investor filed a 13D and indicated interest in taking the company private.While financial players continue to circle the wagons for Lee, we believe that investors should take note. In our view, the LEE shares are compelling and offer a favorable risk/reward relationship.
Figure #15 Publishing Industry Q2 YoY Revenue Growth
Source: Eikon and Company filings
Figure #16 Q2 Publishing Industry EBITDA Margins
Source: Eikon and Company filings
Figure #17 Publishing Industry Comparables

Source: Eikon, Company filings and Nobles estimates
Reports with important disclosure information of companies highlighted in this report may be found here:
GENERAL DISCLAIMERS
All statements or opinions contained herein that include the words “we”, “us”, or “our” are solely the responsibility of Noble Capital Markets, Inc.(“Noble”) and do not necessarily reflect statements or opinions expressed by any person or party affiliated with the company mentioned in this report. Any opinions expressed herein are subject to change without notice. All information provided herein is based on public and non-public information believed to be accurate and reliable, but is not necessarily complete and cannot be guaranteed. No judgment is hereby expressed or should be implied as to the suitability of any security described herein for any specific investor or any specific investment portfolio. The decision to undertake any investment regarding the security mentioned herein should be made by each reader of this publication based on its own appraisal of the implications and risks of such decision.
This publication is intended for information purposes only and shall not constitute an offer to buy/sell or the solicitation of an offer to buy/sell any security mentioned in this report, nor shall there be any sale of the security herein in any state or domicile in which said offer, solicitation or sale would be unlawful prior to registration or qualification under the securities laws of any such state or domicile. This publication and all information, comments, statements or opinions contained or expressed herein are applicable only as of the date of this publication and subject to change without prior notice. Past performance is not indicative of future results. Noble accepts no liability for loss arising from the use of the material in this report, except that this exclusion of liability does not apply to the extent that such liability arises under specific statutes or regulations applicable to Noble. This report is not to be relied upon as a substitute for the exercising of independent judgement. Noble may have published, and may in the future publish, other research reports that are inconsistent with, and reach different conclusions from, the information provided in this report. Noble is under no obligation to bring to the attention of any recipient of this report, any past or future reports. Investors should only consider this report as single factor in making an investment decision.
IMPORTANT DISCLOSURES
This publication is confidential for the information of the addressee only and may not be reproduced in whole or in part, copies circulated, or discussed to another party, without the written consent of Noble Capital Markets, Inc. (“Noble”). Noble seeks to update its research as appropriate, but may be unable to do so based upon various regulatory constraints. Research reports are not published at regular intervals; publication times and dates are based upon the analyst’s judgement. Noble professionals including traders, salespeople and investment bankers may provide written or oral market commentary, or discuss trading strategies to Noble clients and the Noble proprietary trading desk that reflect opinions that are contrary to the opinions expressed in this research report.
The majority of companies that Noble follows are emerging growth companies. Securities in these companies involve a higher degree of risk and more volatility than the securities of more established companies. The securities discussed in Noble research reports may not be suitable for some investors and as such, investors must take extra care and make their own determination of the appropriateness of an investment based upon risk tolerance, investment objectives and financial status.
Company Specific Disclosures
The following disclosures relate to relationships between Noble and the company (the “Company”) covered by the Noble Research Division and referred to in this research report.
Noble is not a market maker in any of the companies mentioned in this report. Noble intends to seek compensation for investment banking services and non-investment banking services (securities and non-securities related) with any or all of the companies mentioned in this report within the next 3 months
ANALYST CREDENTIALS, PROFESSIONAL DESIGNATIONS, AND EXPERIENCE
Senior Equity Analyst focusing on Basic Materials & Mining. 20 years of experience in equity research. BA in Business Administration from Westminster College. MBA with a Finance concentration from the University of Missouri. MA in International Affairs from Washington University in St. Louis.
Named WSJ ‘Best on the Street’ Analyst and Forbes/StarMine’s “Best Brokerage Analyst.”
FINRA licenses 7, 24, 63, 87
WARNING
This report is intended to provide general securities advice, and does not purport to make any recommendation that any securities transaction is appropriate for any recipient particular investment objectives, financial situation or particular needs. Prior to making any investment decision, recipients should assess, or seek advice from their advisors, on whether any relevant part of this report is appropriate to their individual circumstances. If a recipient was referred to Noble Capital Markets, Inc. by an investment advisor, that advisor may receive a benefit in respect of
transactions effected on the recipients behalf, details of which will be available on request in regard to a transaction that involves a personalized securities recommendation. Additional risks associated with the security mentioned in this report that might impede achievement of the target can be found in its initial report issued by Noble Capital Markets, Inc.. This report may not be reproduced, distributed or published for any purpose unless authorized by Noble Capital Markets, Inc..
RESEARCH ANALYST CERTIFICATION
Independence Of View
All views expressed in this report accurately reflect my personal views about the subject securities or issuers.
Receipt of Compensation
No part of my compensation was, is, or will be directly or indirectly related to any specific recommendations or views expressed in the public
appearance and/or research report.
Ownership and Material Conflicts of Interest
Neither I nor anybody in my household has a financial interest in the securities of the subject company or any other company mentioned in this report.