
Is the Halloween Investment Strategy a Trick or a Treat?
What Is the Halloween Strategy? Is it statistically reliable? What have the results been?
The directive, “Always remember to buy in November,” has a few different names; the Halloween effect, the Halloween indicator, are among the more common. It answers the question, If I sell in May and walk away, when do I come back? This is because the “Halloween Strategy” and the “Sell in May” strategies are related — they are different ways of suggesting the same action. The results should be identical.
What Is It?
The Halloween strategy is over a century old. Buying when October ends is essentially a market-timing strategy based on the thought that the overall stock market performs better between Oct. 31st (Halloween) and May 1st than it performs from May through the end of October. The directive suggests first that market timing yields better results than buy and hold. Secondly, it says the probability of better results compared to buying and holding is increased, over this period. Those who subscribe to this approach recommend not investing at all during the summer months.
Evidence suggests this strategy does perform well over time, but despite many theories, there is no clear or agreed-upon reason. A famous study was done by Sven Bouman (AEGON Asset Mgmt.) and Ben Jacobsen (Erasmus University Rotterdam) and published in the American Economic Review December 2002. The study documents the existence of a strong seasonal effect in stock returns based on the Halloween indicator. They found the “inherited wisdom” to be true globally and useful in 36 of the 37 developed and emerging markets they studied. They reported the Sell in May effect tends to be particularly strong in European countries and is robust over time. Their sample evidence shows that in the UK the effect has been noticeable since 1694. They also reported, “While we have examined a number of possible explanations, none of these appears to explain the puzzle convincingly.”
Is it Reliable?
I didn’t go back as far as 1694 the way Sven and Ben did. And I didn’t collect data from emerging and developed markets around the globe. More pertinent to Channelchek readers is whether this strategy used on the U.S. markets has been worthwhile.
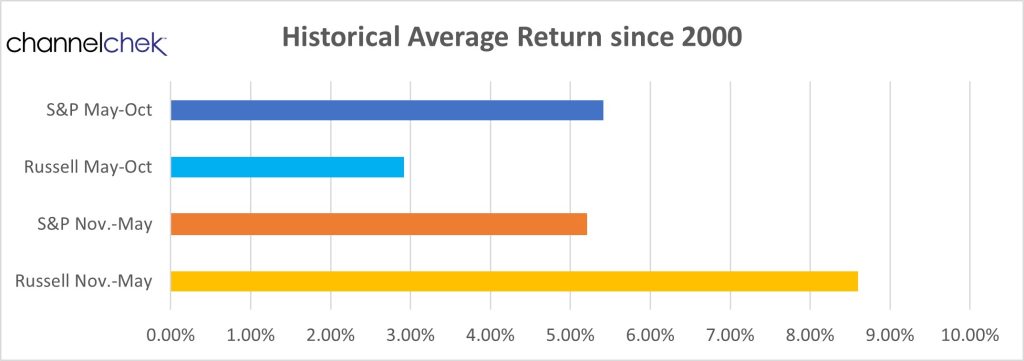
The above chart is a compilation of average results for two six-month periods, May through October and November through April. It also looks at two different indexes, the largest stocks in the S&P 500 (blue shades) index and small-cap stocks of the Russell 2000 (orange shades).
What was discovered is that during the period, investors in either of these indexes would have had positive earnings during either “season.” So it supports “buy and hold” wisdom or, at least, staying invested. During the Halloween through May period, the smallcap Russell returned 8.60%, while during the other six months, performance was a weaker 2.92%. The S&P 500 maintained consistent averages in the low 5% area for either period.
What Have the Results Been?
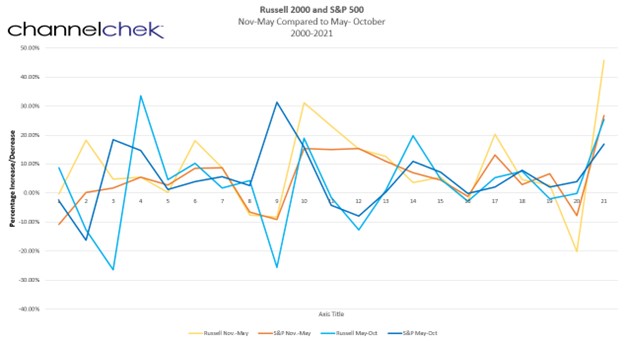
Since the turn of the century, investors would have fared better if they bought stocks represented in the small-cap average after Halloween, then moved to S&P 500 stocks in May. Below are the results of the 21 periods. The highest returns of either index occurred during the latest Halloween to May cycle. It was the small-cap index that measured a 45.76% gain. The index also measured the second-highest gain during the Sell in May 2004 measurement period. The Sell in May small-cap index also can claim the two lowest performance numbers.
Take-Away
The Halloween strategy says that investors should be fully invested in stocks from November through April, and out of stocks from May through October. Variations of this strategy and its accompanying axioms have been around for over a century. Looking at the last 21 years, a deviation that would have paid off would have been moving to small-caps after Halloween.
Both “seasons,” for both measured indexes had positive average earnings. So the notion of staying fully invested is supported using recent data.
Managing Editor, Channelchek


