
INTERNET AND DIGITAL MEDIA COMMENTARY
The More Things Change…..
Internet and Digital Media stocks declined for the fourth consecutive quarter in a row. It wasn’t all bad, as two of Noble’s Internet and Digital Media Indices outperformed the broader market (which we define as the S&P 500). Noble’s Ad Tech (+7%) and eSports & iGaming (+7%) Indices each finished up for the quarter, and significantly outperformed the S&P 500 Index in the process, which decreased by 5% in 3Q 2022. These two sectors also materially outperformed Noble’s other Internet & Digital Media subsectors, including Noble’s Digital Media Index (-10%); Social Media Index (-15%) and MarTech Index (-16%).
Noble Indices are market cap weighted, and we attribute the relative strength of the Ad Tech Index to The Trade Desk (TTD), the Ad Tech sector’s largest market cap company, whose shares were up 42% during the quarter. Other notable performers were Digital Media Solutions (DMS; +73%) which announced a deal to be taken private, and Zeta Global (ZETA; +46%), whose 2Q results significantly exceeded guidance. Despite the relative strength of the sector, returns were not broad-based: only 9 of the 23 stocks in the Ad Tech sector were up during the quarter.
The relative strength of Noble’s eSports and iGaming sector was also driven by the largest cap stocks in the sector. Shares of Draft Kings (DKNG) increased by 30% while shares of Flutter Entertainment (ISE:FLTR), the owner of FanDuel, increased by 17%. Shares of sports betting stocks have been battered this year as investors have become skeptical of the time it might take for these companies to reach profitability amidst a backdrop of a slowing economy and consumer propensity to spend.
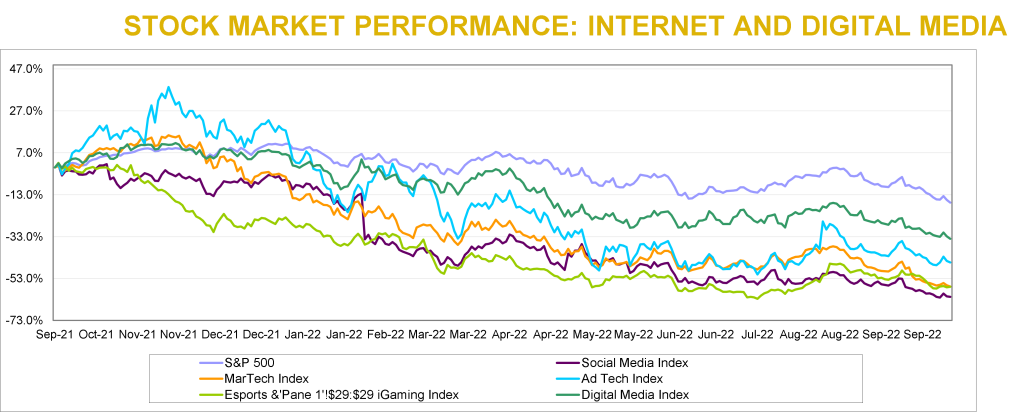
Year-to-date, FLTR shares are down 19% while DKNG shares are down 45%. Shares are down even more relative to their highs reached in 4Q 2020. Like the Ad Tech sector, the eSports & iGaming sector’s relative strength was not broad-based: only 4 of the 16 stocks in this sector were up during the third quarter, and all of stocks in the sector are down year-to-date.
The worst performing sector was the MarTech sector, which is also the least profitable sector, which likely explains the sector’s underperformance. Only 4 of the 24 companies we monitor in this sector generate positive EBITDA, and investors migrated away from unprofitable growth stocks towards more profitable companies or defensive sectors that might withstand a recession better. Investors would clearly like to see companies in this sector accelerate their path to profitability, and most companies in the sector are responding accordingly. To be fair, some of the companies that aren’t EBITDA positive do generate positive cash flow from operations, which is a quirk of SaaS software accounting. Of the two dozen companies in this sector, the only stock that was up during the quarter was Harte-Hanks (HHS), whose shares increased by 68%. HHS continues to generate improved operating results while lowering its debt and pension obligations.
MarTech stocks have also been victims of their own success. Earlier this year the group traded at average revenue and EBITDA multiples of 8.5x and 70.8x, respectively. Today the same group trades at average revenue and EBITDA multiples of 4.5x and 30.1x, respectively. Stocks like Shopify (SHOP), and Hubspot (HUBS) entered the year trading at 22.2x and 14.7x 2022E revenues, respectively, and now trade at 5.3x, and 7.7x, respectively. Some of this appears to be a Covid-related hangover: when Covid hit, retail companies needed to emphasize their online channels, and companies like Shopify benefited. As consumers return to stores, growth has moderated. Shopify aside, the broader message investors seem to be sending is that recurring revenues are great, but not if they are paired with EBITDA losses at a time when economy appears to be heading into a potential recession.
M&A Continues to Hold Up Well Despite Macro Headwinds
Overall, we are impressed with the resiliency of the M&A marketplace in the Internet & Digital Media sectors. Despite a background that includes public equity market volatility, Fed rate hikes, persistent inflation, contractionary monetary policy, and geopolitical conflict, the M&A marketplace has held up relatively well, all things considered. Noble tracked 163 transactions in the third quarter of 2022 in the TMT sectors we follow, a 9% increase compared to the third quarter of 2021, when we tracked 150 deals, and 6% sequential slowdown compared to 2Q 2022, when we tracked 174 transactions. Year-to-date, the number of M&A transactions is up 7% vs. the year ago period, with 516 announced transactions this year compared to 483 transactions announced through the end of last year’s third quarter.
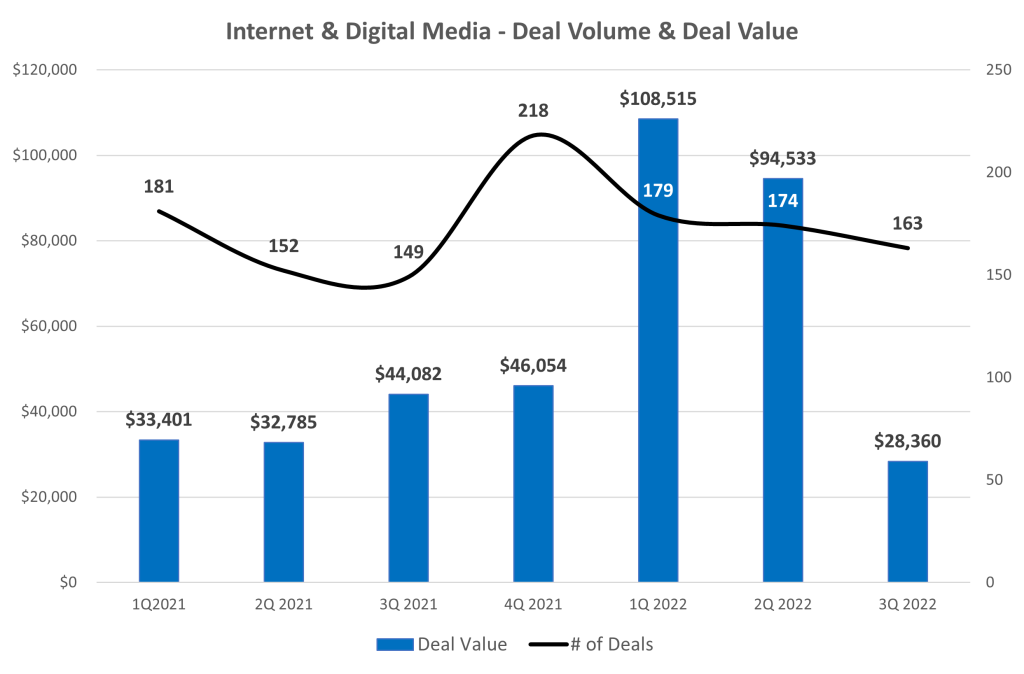
The real difference between 2022 and 2021 is the dollar value of transactions. Total deal value in 3Q 2022 fell by 36% to $28.4 billion, down from $44.1 billion in 3Q 2021. On a sequential basis, the $28.4 billion in deal value represents a 70% decrease from 2Q 2022 levels of $94.5 billion, nearly half of which reflects Elon Musk’s $46 billion offer to acquire Twitter (TWTR).
In looking at the M&A trends in the chart on the previous page, the biggest change is not the number of deals, but primarily the number of mega-deals. There was only one transaction in 3Q 2022 that was greater than $10 billion dollars: Adobe’s $19.4 billion acquisition of Figma, a collaborative all-in-one design platform. This decline in larger deal activity suggests acquirers are becoming more cautious about making big bets in the current environment or it could also mean that arranging for financing to close on larger deals is becoming more challenging. No doubt the cost to incur debt to close on transactions today are higher than they were just a few months ago, which lowers the return on debt financed M&A transactions. Referencing the Twitter deal again, according to media reports, Apollo Global Management and Sixth Street Partners, which had agreed to provide financing for the Twitter deal when it was first announced in April, are no longer in talks with Elon Musk to provide financing.
From a deal volume perspective, the most active sectors we tracked were Marketing Tech (44 deals), Digital Content (43 deals) and Agency & Analytics (28 deals) and Information (25 deals). From a deal value perspective, the largest transaction was Adobe’s nearly $20 billion acquisition of Figma, a collaborative design software company. Other active sectors were Marketing Tech ($4.9 billion), Information ($1.1 billion, and Digital Content ($1.1B).
Video Game M&A Declines Precipitously
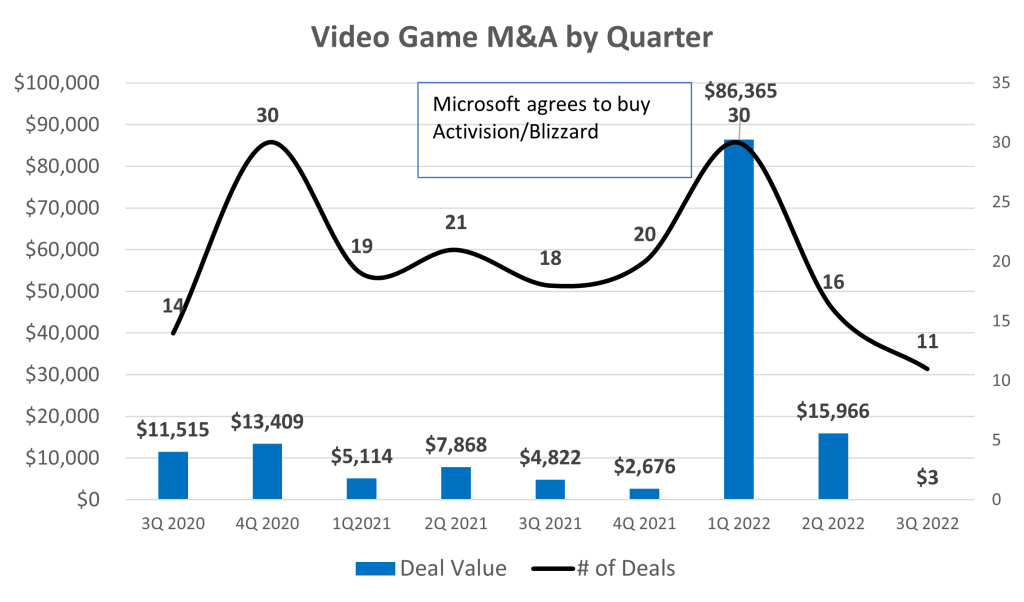
For the last several quarters we have noted how strong M&A activity was in the current quarter. Perhaps the biggest surprise of the third quarter M&A analysis was the steep drop in M&A in North America in the video gaming sector. Interest in the video gaming sector exploded at the onset of the pandemic as work form home edicts resulted in less commuting time and more time playing video games. As the pandemic has subsided and consumers return to work, the sector has faced difficult comparions, and growth has been challenged.
As shown in the chart below, over the last several quarters, the sector had averaged 21 deals per quarter and $18+ billion in deal value. In the third quarter, there were only 11 announced transactions, and only one with a transaction price announced, resulting in just $3 million of deal value. Perhaps there is some consolation in that the second largest transaction in 3Q 2022 was a gaming related transaction: Unity Software’s agreement to buy IronSource Ltd, a lead generation platform for in-game advertising, for $4.4 billion.
While we expect M&A transactions to moderate given the difficult economic backdrop and an increase in the cost of financing transactions, we expect M&A marketplace to remain resilient. In our discussions with management teams in Internet & Digital Media sectors, we are struck by how many companies believe that industry consolidation is either beneficial or necessary. Scale is widely seen as a panacea to potential slowing or declining revenue trends.
iGaming
The following is an excerpt from a recent note by Noble’s Media Equity Research Analyst Michael Kupinski
The past year has been tough on the iGaming industry. The Noble iGaming Index is down nearly 54% versus a negative 17% for the general market, as measured by the S&P 500 Index. In the latest quarter, the iGaming stocks seemed to have stabilized, up 2% versus a continued general market decline, down 5% for the general market. Interestingly, the iGaming sector was the best performing sector among the Entertainment and Esports sectors, which were up a modest 1% and down 38%, respectively.
The shares of Codere Online (CDRO) could not fight the headwinds of the industry-wide selling pressure. CDRO shares dropped 70% from its post de-SPACing in December 2021. The weakness in the shares has been in spite of the company executing on its growth strategy as planned and maintaining its fundamental pace to meet full-year guidance. In the latest quarter, the shares drifted lower (-4%) versus the industry which increased 2%.
The poor performance of the iGaming industry in many respects is due to the developmental nature of the industry. Many of the companies included in the Noble iGaming index do not generate positive cash flow, with balance sheets supporting growth investment. Certainly, there will be a shake-out of players in the industry that do not have the financial capability to invest for growth, but we believe that Codere Online is one of the survivors.
Although the company is not yet cash flow positive, its operations in Spain generated its highest quarterly cash flow since Q2 2020. Adj. EBITDA in Spain was $3.6 million, enough to offset 87% of the $4.1 million adj. EBITDA loss from the company’s operations in Mexico. Interestingly, the marketing restrictions in the country came with a silver lining of lower competition. This is because the restrictions make it harder for newer operators to establish their brands in the country. Additionally, the lower marketing costs contributed to the strong cash flow generation. Notably, management expects similar cash flow generation going forward for the Spanish operations. We view the situation in Spain favorably as the consistent cash flow profile will help fund the expansion in Latin America and have a mitigating impact on the company’s cash burn.
eSports
The Esports industry had a difficult year and a difficult quarter in terms of stock performance. The horrible stock performance does not reflect the overall industry trends. Video gaming is still on the rise. It is estimated that there are 2.7 billion gamers worldwide, expected to achieve an estimated 3.0 billion gamers in 2023, based on Newzoo’s numbers. The video game market is expected to reach $159.3 billion this year and grow to $200.0 billion in 2023. So, what about the Esports industry? Esports viewership was elevated during the Covid lockdowns, with viewership significantly higher. Viewership trends are expected to increase even from the elevated 2020 levels to over 640 million viewers in 2025.
TRADITIONAL MEDIA COMMENTARY
The following is an excerpt from a recent note by Noble’s Media Equity Research Analyst Michael Kupinski
Overview
Downward trends, but some bright spots
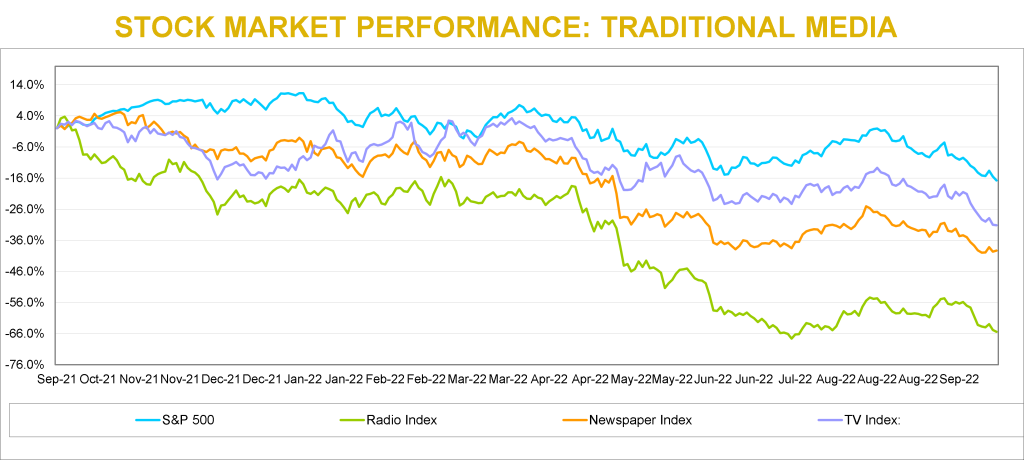
Traditional Media stocks have had tough sledding this year. All of Noble’s Traditional Media Indices have declined over the past 12 months and each have underperformed the general market. The downward spiral seemed to have moderated somewhat in the third quarter.
Notably, during the third quarter, many of the stocks had a very nice bounce before resuming a downward trend. At one point in the latest quarter, stocks were up as high as 30% from the second quarter end. It is important to note that only the Publishing stocks outperformed the general market in the latest quarter.
Broadcast Television
Will Political Carry The Quarter?
Noble’s TV Index dropped 10% in the third quarter, underperforming the broader market (-5%) As we indicated in our previous quarterly report, we believe that there would be a trading opportunity in media stocks. The latest quarter stock performance indicated that. Many of the TV stocks had a strong performance from the end of the second quarter (June 30) to highs achieved in August. Many of the TV stocks increased a strong 25% on average. It is instructive to know that E.W. Scripps had the largest advance from June 30 lows, up 31% to highs achieved August 16. When the industry is in favor, the shares of E.W. Scripps tends to outperform its industry peers. The shares of Entravision (EVC) were the next best performing within the quarter, up 30%, before trading lower and ending down 12%.
TV stocks were challenged by macro-economic pressures such as inflation, the rising cost of borrowing, and a Fed determined to curb inflation by slowing the economy. In the end, interest rate increases by the Fed curbed enthusiasm for TV stocks and the Noble TV Index ended the third quarter down.
The average television company reported 11% revenue growth in the latest quarter. Most broadcasters were very optimistic about political advertising, with some raising forecasts to be near the levels of the Presidential election, a highwater mark. We would note that Entravision had the highest revenue performance in the quarter, up 24%, as the company continues to benefit from its transition toward faster growth digital advertising, which now accounts for over 80% of its total company revenues.
EBITDA margins were healthy, with the average margin for the industry at 25.5%. It is notable to mention that Entravision’s margins appear to be significantly below that of the industry at 10%. Its digital advertising business is a rep firm business, and, as such, the company reports revenues on a net basis and not gross revenues. While a rep firm business tends to be a lower margin business, the accounting treatment for rep revenues gives the appearance of very low margins. The company is in a strong cash flow and free cash flow position.
Most companies will be reporting third quarter financial results in the first two weeks in November. We believe that the third quarter will reflect an influx of political advertising, even though the lion share of the political advertising likely will fall in the fourth quarter. Consequently, we believe that the third quarter revenue growth will be better than the second quarter, showing some acceleration. With signs of weakening national advertising, and a likely weakening local advertising environment in some larger markets, broadcasters are looking forward toward Q4 political advertising as an offset. Many broadcasters indicated that political advertising may be at record levels in 2022, even higher than the Presidential election year of 2020. Political advertising, however, is not usually evenly spent across all markets. As such, there may be winners and some disappointment.
Investors are not encouraged to buy a Television broadcaster on the basis of the upcoming fourth quarter political advertising influx. There are broader issues at play, like cord cutting, slowing retransmission revenue growth, and the prospect for a weakening economy. We believe broadcasters with minimal emphasis on national advertising, a larger focus on small to medium size markets and local advertising, are best positioned to weather an economic downturn. We also like companies that do not have high debt leverage. In addition, we like diversified companies that can benefit from cord cutting, like E.W. Scripps, or have diversified revenue streams and large fast growing digital businesses, like Entravision.
Broadcast Radio
Polishing its tarnished image
One of the epic fails of the radio industry has been Audacy (AUD), once one of the leadership companies in the industry. AUD shares are down a staggering 95% from highs in March 2021. The poor stock performance reflects the poor revenue and cash flow performance and high debt levels at the company. Recently, the company announced that it plans to sell some of its prized assets, including its podcasting business, Cadence 13, in an effort to more aggressively pare down debt.
While Audacy struggles, there are emerging leaders in the industry, many that are not focused on its radio business. The average radio revenue grew 8.9%. Companies that were at the top of the list of revenue growth had diversified revenue streams. Townsquare Media (TSQ) was the best performer, with Q2 revenue growth of 13.6%. We believe that Townsquare also benefits from significantly lower national advertising and concentration on less cyclical larger markets. Other diversified companies that performed better than the lower growth companies in the group were Salem Media and Beasley Broadcasting. Salem Media has diversified into content creation and digital media and Beasley recently accelerated its push into Digital Media. Separately, Beasley recently announced a station swap with Audacy, which will enhance its position in with its four existing stations in Las Vegas.
On the margin front, Townsquare Media also was among the leaders in the industry. Notably, Townsquare Media’s digital business carries margins similar to its radio businesses, near 30%. As such, its investments in Digital Media are not depressing its total company margins. Townsquare’s Q2 adj. EBITDA margins were 27%, well above that of the larger industry peers like iHeart (25%), Cumulus Media (19%), and Audacy (12%).
In looking forward toward the upcoming third quarter results, which will be released in coming weeks, we believe that the effects of rising inflation and weakening economy will start to show. Many of the larger broadcasters which focus on larger markets, have national network business, may disappoint. In addition, we believe that there will be spotty political advertising performances. In our view, the resulting potential weakness in the stocks may create an opportunity to more aggressively accumulate or establish positions.
Radio stocks largely mirrored the performance of the TV industry, falling 9% in the third quarter. Last quarter we pointed out that large industry players such as Audacy and iHeart had an outsized negative impact on the market cap-weighted index. This was due to the stocks being downgraded by a Wall Street firm on the basis of high leverage in a time of recession.
However, there are several broadcasters in the radio industry with improving leverage profiles. Furthermore, we believe that in a time when traditional radio companies are making a transition to more digitally based revenue sources, investors would do well to differentiate among them on that basis as well. In our view, certain companies are ahead of peers in the digital transformation and are better shielded from certain fundamental headwinds that have traditionally plagued radio broadcasters in prior recessions, such as Townsquare Media (TSQ), Salem Media (SALM), and Beasley Broadcasting (BBGI).
Publishing
Once a leader, now a laggard
It is hard to believe that Gannett was once a $90 stock and held a record for one of the longest strings of quarterly earnings gains in the S&P 500 Index. The shares are down 80% from year earlier highs to near $1.37. For some anti newspaper investors, this is a “told you so” moment. But, this view missed notable exceptions, like the New York Times, which seemed to transition more quickly toward digital revenues. There are publishers that are set apart from the weak trends at Gannett and are on a favorable trajectory toward a digital future. As such, we believe that investors should not throw the baby out with the bathwater or avoid the industry. There are gems here, which is discussed later in this report.
There were sizable differences in the financial performance of the companies in the publishing group.Q2 publishing revenue declined on average 1.5%. The notable exceptions to this performance was The New York Times, up 11.5%, News Corp, up 7.3%, and Lee Enterprises, down a modest 0.7%. The improved performance into the ranks of the leaders in the industry is quite notable. Lee’s digital subscriptions currently lead the industry. The company has exceeded all of its peers in terms of digital subscription growth in the past 11 consecutive quarters. Furthermore, over 50% of its advertising is derived from digital. Currently, roughly 30% of the company total revenues are derived from digital, still short of the 55% at The New York Times, but closing the gap.
Not only is Lee performing well on the digital revenue front, it has industry leading margins. Lee’s Q2 EBITDA margins were 12%, in line with News Corp and second only to the New York Times at 17%. We believe that margins should improve over time as the company continues to migrate toward a higher digital margin business model.
Noble’s Publishing Index, which decreased a modest 2% in the quarter, outperforming the S&P (-5%). The relatively favorable performance of the index was primarily due to its largest constituents, News Corp. and The New York Times, which rebounded from -30% and -39%, respectively in Q2, to -3% and +3%, respectively, in Q3. The average percentage change of the stocks in the industry was -16%, more in line with Traditional Media as a whole. One of the poor performing stocks in the index for the quarter was Gannett (GCI) which declined 47%. It was recently reported that the company implemented austerity measures included unpaid leave and voluntary layoffs. In the case of Lee Enterprises, the shares were down a much more modest 7%, more in line with the general market.
LEE shares trade at an average industry multiple of 5.8 times Enterprise Value to our 2023 adj. EBITDA estimate. Notably, the company is closing the gap with its Digital Media revenue contribution to that of New York Times, which is currently trading at an estimated 14.5 times EV to 2023 adj. EBITDA. We believe that the valuation gap with the New York Times should close as well. In recent Lee Enterprise news, a buyout specialist investor filed a 13D and indicated interest in taking the company private. While financial players continue to circle the wagons for Lee, we believe that investors should take note.
DOWNLOAD THE FULL REPORT (PDF)
View the PDF version for segment analysis, M&A activity, and more…
Noble Capital Markets Media Newsletter Q3 2022
This newsletter was prepared and provided by Noble Capital Markets, Inc. For any questions and/or requests regarding this news letter, please contact Chris Ensley
DISCLAIMER
All statements or opinions contained herein that include the words “ we”,“ or “ are solely the responsibility of NOBLE Capital Markets, Inc and do not necessarily reflect statements or opinions expressed by any person or party affiliated with companies mentioned in this report Any opinions expressed herein are subject to change without notice All information provided herein is based on public and non public information believed to be accurate and reliable, but is not necessarily complete and cannot be guaranteed No judgment is hereby expressed or should be implied as to the suitability of any security described herein for any specific investor or any specific investment portfolio The decision to undertake any investment regarding the security mentioned herein should be made by each reader of this publication based on their own appraisal of the implications and risks of such decision This publication is intended for information purposes only and shall not constitute an offer to buy/ sell or the solicitation of an offer to buy/sell any security mentioned in this report, nor shall there be any sale of the security herein in any state or domicile in which said offer, solicitation or sale would be unlawful prior to registration or qualification under the securities laws of any such state or domicile This publication and all information, comments, statements or opinions contained or expressed herein are applicable only as of the date of this publication and subject to change without prior notice Past performance is not indicative of future results.
Please refer to the above PDF for a complete list of disclaimers pertaining to this newsletter


