Research News and Market Data on EGLE
Reports Record Full Year Net Income of $248 million
March 02, 2023 16:45 ET
STAMFORD, Conn., March 02, 2023 (GLOBE NEWSWIRE) — Eagle Bulk Shipping Inc. (NYSE: EGLE) (“Eagle” or the “Company”), one of the world’s largest owner-operators within the midsize drybulk vessel segment, today reported financial results for the three months and year ended December 31, 2022.
Quarter Highlights:
- Generated Revenues, net of $151.4 million
- Achieved TCE(1) of $22,062/day based on TCE Revenues(1) of $102.5 million
- Realized net income of $23.3 million, or $1.79 per basic share
- Adjusted net income(1) of $35.9 million, or $2.76 per basic share(1)
- Generated EBITDA(1) of $41.3 million
- Adjusted EBITDA(1) of $55.6 million
- Executed an agreement to purchase a 2015-built, high specification Ultramax for $24.3 million
- Vessel delivered to the Company in February 2023 and renamed the M/V Gibraltar Eagle
- Declared a quarterly dividend of $0.60 per share for the fourth quarter of 2022
- Dividend is payable on March 23, 2023 to shareholders of record at the close of business on March 15, 2023
Recent Developments:
- Completed transfer of listing to the New York Stock Exchange (NYSE) on January 4, 2023
- Appointed Kate Blankenship to the Board of Directors on January 18, 2023
- Executed agreements to purchase two 2020-built high specification scrubber-fitted Ultramaxes for $30.1 million each
- Vessels are expected to be delivered to the Company during the second quarter of 2023 and will be renamed the M/V Halifax Eagle and M/V Vancouver Eagle
- Executed an agreement to sell the M/V Jaeger (2004-built Supramax) for $9.0 million
- Transaction is expected to close in March 2023
- Fixed 92% of available days for the first quarter of 2023 at an average TCE of $13,335
1 These are non-GAAP financial measures. A reconciliation of GAAP to non-GAAP financial measures has been provided in the financial tables included in this press release. An explanation of these measures and how they are calculated are also included below under the heading “Supplemental Information – Non-GAAP Financial Measures.”
Eagle’s CEO Gary Vogel commented, “Despite a weaker rate environment, our Q4 results cemented a record annual profit of roughly $250 million for 2022. These results are reflective of the many actions we have taken over the past years, including our comprehensive vessel sale and purchase strategy encompassing 55 transactions, our segment-leading focus on scrubbers, our differentiated active management approach to trading ships, and our efforts to optimize the balance sheet.
Based on this and consistent with the company’s stated capital allocation strategy of distributing a minimum of 30% of net income, the company declared its sixth consecutive quarterly dividend since adoption of the policy, bringing total shareholder distributions to $10.65 per share, or $139 million.
In recent months, we continued to enhance and grow our fleet. We purchased three modern high specification Ultramaxes, two of which are scrubber-fitted, and sold the oldest vessel in our fleet. It is noteworthy that this sale represents the 22nd, and last, vessel to be sold as part of the initial fleet renewal program which we initiated six years ago.
As we enter 2023, we remain positive on market fundamentals given a historically low orderbook with a rapidly aging fleet, as well as a number of demand catalysts including China’s reopening post Covid restrictions,” continued Mr. Vogel. “While uncertainty in the macro-economic environment has brought volatility, both rates and forward curves have moved up substantially in recent days. Further, with our modern fleet of 55, predominately scrubber-fitted vessels, and a robust balance sheet with investment capacity, the company remains uniquely positioned to deliver value to our stakeholders.”
Fleet Operating Data
Fleet Development
- Tokyo Eagle, a Japanese-built, scrubber-fitted Ultramax (61k DWT / 2015-built), acquired in the third quarter of 2022 for total consideration of $27.5 million, was delivered to the Company in the fourth quarter of 2022
- Gibraltar Eagle, a Chinese-built Ultramax (64k DWT / 2015-built), acquired in the fourth quarter of 2022 for total consideration of $24.3 million, was delivered to the Company in the first quarter of 2023
- Halifax Eagle, a Chinese-built, scrubber-fitted Ultramax (64k DWT / 2020-built), acquired in the first quarter of 2023 for total consideration of $30.1 million, is expected to be delivered to the Company in the second quarter of 2023
- Vancouver Eagle, a Chinese-built, scrubber-fitted Ultramax (64k DWT / 2020-built), acquired in the first quarter of 2023 for total consideration of $30.1 million, is expected to be delivered to the Company in the second quarter of 2023
- Jaeger, a Japanese-built Supramax (52k DWT / 2004-built), sold in the first quarter of 2023 for total consideration of $9.0 million, is expected to be delivered to the buyer in the first quarter of 2023
- Pro forma owned fleet totals 55 vessels with an average age of 9.1 years
Results of Operations for the three months and years ended December 31, 2022 and 2021
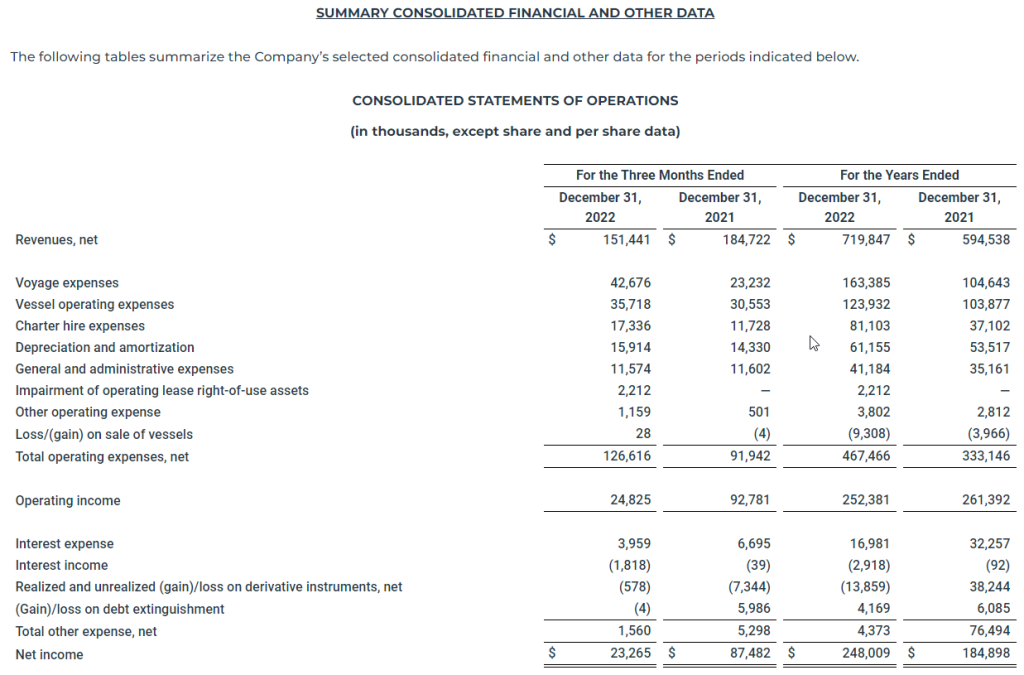
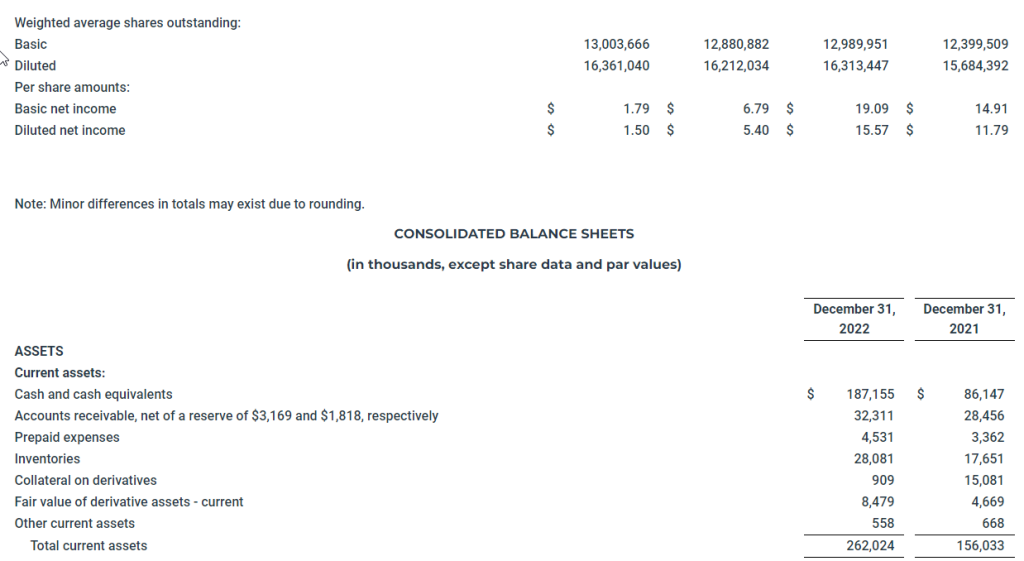
For the three months ended December 31, 2022, the Company reported net income of $23.3 million, or basic and diluted net income per share of $1.79 and $1.50, respectively. In the comparable quarter of 2021, the Company reported net income of $87.5 million, or basic and diluted net income per share of $6.79 and $5.40, respectively.
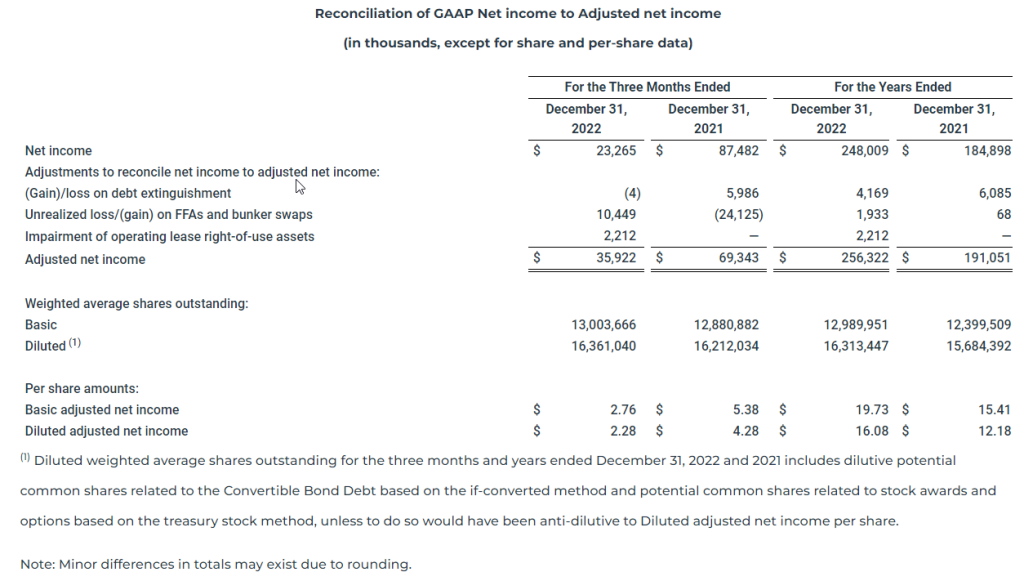
For the three months ended December 31, 2022, the Company reported adjusted net income of $35.9 million, which excludes unrealized losses on derivative instruments and impairment of operating lease right-of-use assets of $10.4 million and $2.2 million, respectively, or basic and diluted adjusted net income per share of $2.76 and $2.28, respectively. In the comparable quarter of 2021, the Company reported adjusted net income of $69.3 million, which excludes unrealized gains on derivative instruments and a loss on debt extinguishment of $24.1 million and $6.0 million, respectively, or basic and diluted adjusted net income per share of $5.38 and $4.28, respectively.
For the year ended December 31, 2022, the Company reported net income of $248.0 million, or basic and diluted net income per share of $19.09 and $15.57, respectively. For the year ended December 31, 2021, the Company reported net income of $184.9 million, or basic and diluted net income per share of $14.91 and $11.79, respectively.
For the year ended December 31, 2022, the Company reported adjusted net income of $256.3 million, which excludes a loss on debt extinguishment, impairment of operating lease right-of-use assets and unrealized losses on derivative instruments of $4.2 million, $2.2 million and $1.9 million, respectively, or basic and diluted adjusted net income per share of $19.73 and $16.08, respectively. For the year ended December 31, 2021, the Company reported adjusted net income of $191.1 million, which excludes a loss on debt extinguishment and unrealized losses on derivative instruments of $6.1 million and $0.1 million, respectively, or basic and diluted adjusted net income per share of $15.41 and $12.18, respectively.
Revenues, net
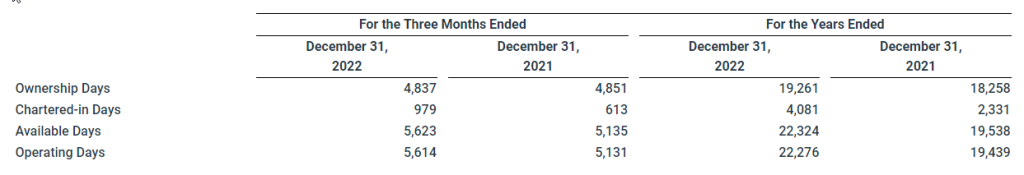
Revenues, net for the three months ended December 31, 2022 were $151.4 million, compared to $184.7 million for the comparable quarter in 2021. Revenues, net decreased $33.3 million primarily due to lower rates driven by declines in the underlying freight market, offset in part by an increase in operating days (5,614 for the three months ended December 31, 2022 compared to 5,131 for the three months ended December 31, 2021).
Revenues, net for the year ended December 31, 2022 were $719.8 million, compared to $594.5 million for the year ended December 31, 2021. Revenues, net increased $87.4 million due to an increase in total operating days (22,276 for the year ended December 31, 2022 compared to 19,439 for the year ended December 31, 2021) driven by increases in both owned days and chartered-in days and increased $37.9 million due to an increase in rates.
Voyage expenses
Voyage expenses for the three months ended December 31, 2022 were $42.7 million compared to $23.2 million for the comparable quarter in 2021. Voyage expenses increased primarily due to an increase in bunker consumption expense of $13.5 million due to an increase in bunker fuel prices, an increase in costs for contingent liabilities of $3.4 million driven by provisions for certain routine commercial claims and an increase in port expenses of $3.4 million primarily driven by an increase in fuel surcharges related to tugs along with cost inflation, partially offset by a decrease in broker commissions of $0.8 million driven by a decrease in related revenues.
Voyage expenses for the year ended December 31, 2022 were $163.4 million, compared to $104.6 million for the year ended December 31, 2021. Voyage expenses increased primarily due to an increase in bunker consumption expense of $43.9 million driven by an increase in bunker fuel prices, an increase in port expenses of $11.8 million driven by an increase in fuel surcharges related to tugs along with cost inflation and an increase in costs for contingent liabilities of $3.4 million driven by provisions for certain routine commercial claims.
Vessel operating expenses
Vessel operating expenses, which include non-recurring expenses related to vessel acquisitions and sales, for the three months ended December 31, 2022 were $35.7 million compared to $30.6 million for the comparable quarter in 2021. Vessel operating expenses increased primarily due to an increase in repair costs of $2.7 million driven by certain discretionary repairs and upgrades as well as unscheduled necessary repairs, an increase in the cost of lubes, stores and spares of $1.2 million driven by increased volumes and cost inflation and an increase in crew-related costs of $1.1 million driven by higher crew wages, increased crew changes and increased expenses related to COVID-19 and the conflict between Russia and Ukraine. Ownership days for the three months ended December 31, 2022 were 4,837, compared to 4,851 for the comparable quarter in 2021.
Average daily vessel operating expenses excluding one-time, non-recurring expenses related to vessel acquisitions and sales and termination charges relating to a change in crewing manager on some of our vessels for the three months ended December 31, 2022 was $6,996, compared to $6,028 for the comparable quarter in 2021.
Vessel operating expenses, which include non-recurring expenses related to vessel acquisitions and sales, for the year ended December 31, 2022 were $123.9 million, compared to $103.9 million for the year ended December 31, 2021, with the increase driven, in part, by an increase in ownership days (19,261 for the year ended December 31, 2022 compared to 18,258 for the year ended December 31, 2021).
The increase in vessel operating expenses was due to an increase in crew-related costs of $8.9 million driven by higher crew wages, increased crew changes and increased expenses related to COVID-19 and the conflict between Russia and Ukraine, an increase in repair costs of $5.6 million driven by certain discretionary repairs and upgrades as well as unscheduled necessary repairs and an increase in the cost of lubes, stores and spares of $5.0 million driven by increased volumes and cost inflation.
Average daily vessel operating expenses excluding one-time, non-recurring expenses related to vessel acquisitions and sales and termination charges relating to a change in crewing manager on some of our vessels for the year ended December 31, 2022 was $6,244, compared to $5,357 for the year ended December 31, 2021.
Charter hire expenses
Charter hire expenses for the three months ended December 31, 2022 were $17.3 million, compared to $11.7 million for the comparable quarter in 2021. Charter hire expenses increased $7.0 million due to an increase in chartered-in days (979 for the three months ended December 31, 2022 as compared to 613 for the comparable quarter in 2021) and was partially offset by a decrease of $1.4 million due to a decrease in charter hire rates primarily driven by declines in the underlying freight market.
Charter hire expenses for the year ended December 31, 2022 were $81.1 million, compared to $37.1 million for the year ended December 31, 2021. Charter hire expenses increased $27.9 million primarily due to an increase in chartered-in days (4,081 for the year ended December 31, 2022 as compared to 2,331 for the year ended December 31, 2021) and increased $16.1 million due to an increase in charter hire rates as well as the impact of exercised extension options on the Company’s long-term charter-in contracts.
Depreciation and amortization
Depreciation and amortization for the three months ended December 31, 2022 was $15.9 million, compared to $14.3 million for the comparable quarter in 2021. Total depreciation and amortization for the three months ended December 31, 2022 included $12.4 million of vessel and other fixed asset depreciation and $3.5 million of deferred drydocking cost amortization. Total depreciation and amortization for the three months ended December 31, 2021 included $11.9 million of vessel and other fixed asset depreciation and $2.4 million of deferred drydocking cost amortization. Depreciation and amortization increased $1.1 million due to the impact of drydocks completed during 2022 and increased $0.5 million due to an increase in the cost base of our owned fleet as well as ballast water treatment systems (“BWTS”) installed during 2022.
Depreciation and amortization for the year ended December 31, 2022 was $61.2 million, compared to $53.5 million for the year ended December 31, 2021. Total depreciation and amortization for the year ended December 31, 2022 included $47.9 million of vessel and other fixed asset depreciation and $13.2 million of deferred drydocking cost amortization. Total depreciation and amortization for the year ended December 31, 2021 included $44.9 million of vessel and other fixed asset depreciation and $8.7 million of deferred drydocking cost amortization. Depreciation and amortization increased $4.6 million primarily due to higher average drydocking expenditures and increased $3.1 million primarily due to the full year impact of vessels acquired during 2021.
General and administrative expenses
General and administrative expenses for each of the three months ended December 31, 2022 and 2021 were $11.6 million.
General and administrative expenses for the year ended December 31, 2022 were $41.2 million, compared to $35.2 million for the year ended December 31, 2021. General and administrative expenses increased $2.6 million due to higher stock-based compensation expense, increased $0.9 million due to an increase in compensation and benefits, increased $0.8 million due to higher professional fees and increased $0.8 million due to higher other corporate costs, including travel and office-related costs.
Other operating expense
Other operating expense for the three months ended December 31, 2022 was $1.2 million, compared to $0.5 million for the comparable quarter of 2021. Other operating expense for each of the three months ended December 31, 2022 and 2021 were primarily comprised of costs related to a 2021 U.S. government investigation into an allegation that one of our vessels may have improperly disposed of ballast water that entered the engine room bilges during a repair. The Company posted a surety bond as security for any potential fines, penalties or other associated costs.
Other operating expense for the year ended December 31, 2022 was $3.8 million, compared to $2.8 million for the year ended December 31, 2021. Other operating expense for the year ended December 31, 2022 was primarily comprised of $2.4 million of costs associated with a corporate transaction that did not materialize and $1.4 million of costs related to the aforementioned investigation. Other operating expense for the year ended December 31, 2021 was primarily comprised of costs related to the aforementioned investigation.
Interest expense
Interest expense for the three months ended December 31, 2022 was $4.0 million, compared to $6.7 million for the comparable quarter of 2021. Interest expense decreased $1.1 million due to lower amortization of debt discounts and deferred financing costs primarily as a result of the Company’s adoption of ASU 2020-06, decreased $1.0 million due to lower outstanding principal balances and decreased $0.6 million due to lower effective interest rates. The decrease in outstanding principal balances and effective interest rates were as a result of the refinancing of the Company’s debt in the fourth quarter of 2021.
Interest expense for the year ended December 31, 2022 was $17.0 million, compared to $32.3 million for the year ended December 31, 2021. Interest expense decreased $5.4 million due to lower effective interest rates and decreased $5.3 million due to lower outstanding principal balances, each as a result of the refinancing of the Company’s debt in the fourth quarter of 2021 and decreased $5.0 million due to lower amortization of debt discounts and deferred financing costs primarily as a result of the Company’s adoption of ASU 2020-06.
Realized and unrealized (gain)/loss on derivative instruments, net
For the three months ended December 31, 2022, the Company recorded a net realized and unrealized gain on derivatives of $0.6 million, compared to a net realized and unrealized gain on derivatives of $7.3 million for the comparable quarter in 2021. Net realized and unrealized gains decreased primarily due to $10.8 million of unrealized losses on FFAs for the three months ended December 31, 2022 compared to $24.9 million in unrealized gains on FFAs for the three months ended December 31, 2021, partially offset by $11.4 million of realized gains on FFAs for the three months ended December 31, 2022 compared to $17.6 million of realized losses on FFAs for the three months ended December 31, 2021, collectively driven by changes in market freight rates and the timing of positions taken.
For the year ended December 31, 2022, the Company recorded a net realized and unrealized gain on derivatives of $13.9 million, compared to a net realized and unrealized loss on derivatives of $38.2 million for the year ended December 31, 2021. The change was primarily due to $11.4 million of realized gains on FFAs for the year ended December 31, 2022 compared to $41.1 million of realized losses on FFAs for the year ended December 31, 2021 driven by changes in market freight rates and the timing of positions taken.
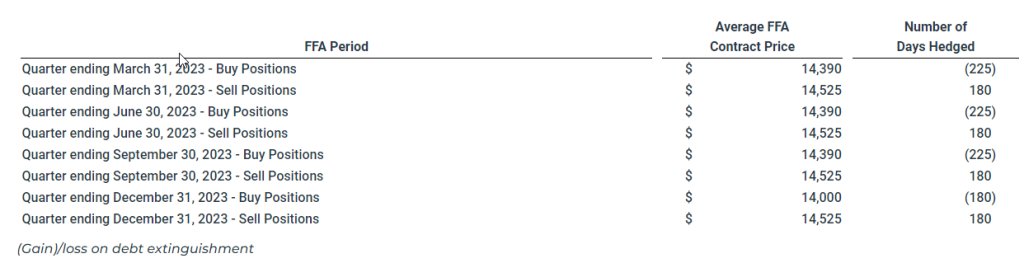
A summary of outstanding FFAs as of December 31, 2022 is as follows:
For the years ended December 31, 2022 and December 31, 2021, the Company recorded a loss on debt extinguishment of $4.2 million and $6.1 million, respectively. During the year ended December 31, 2022, the Company repurchased $10.0 million in aggregate principal amount of Convertible Bond Debt (as defined herein) for $14.2 million in cash and cancelled the repurchased debt. During the three months and year ended December 31, 2021, the Company repaid the then outstanding Norwegian Bond Debt (as defined herein) and accrued interest and discharged the debt in full from the proceeds of the Global Ultraco Debt Facility (as defined herein) and cash on hand. As a result, the loss on debt extinguishment comprised $1.6 million of unamortized debt discount and debt issuance costs, as well as $4.4 million of call premium.
Liquidity and Capital Resources
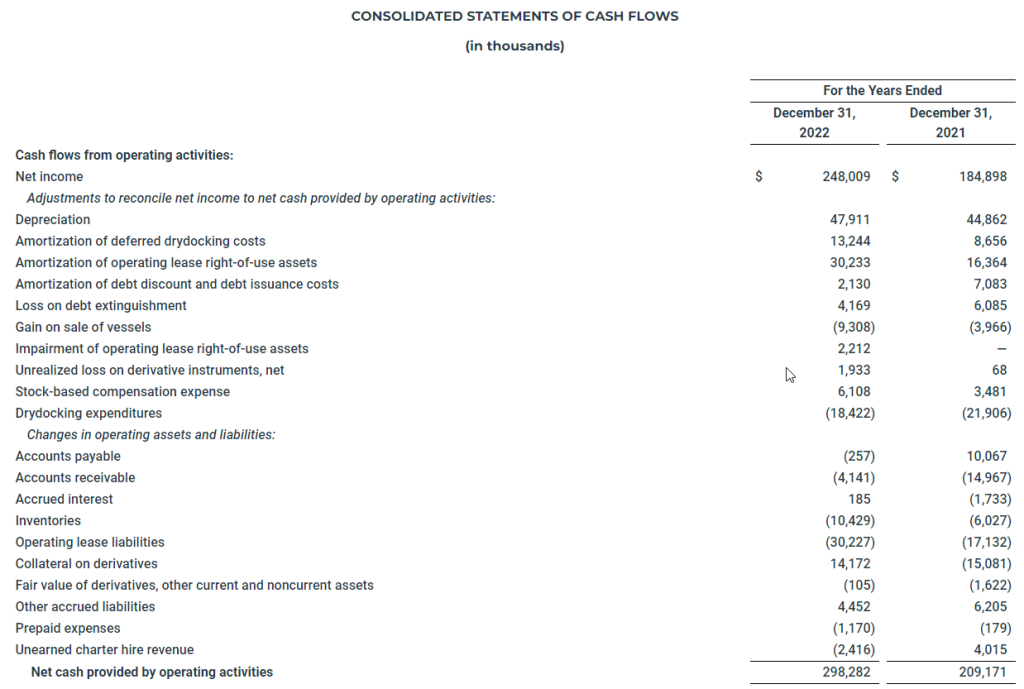
The following table presents the cash flow information for the years ended December 31, 2022 and 2021 (in thousands):
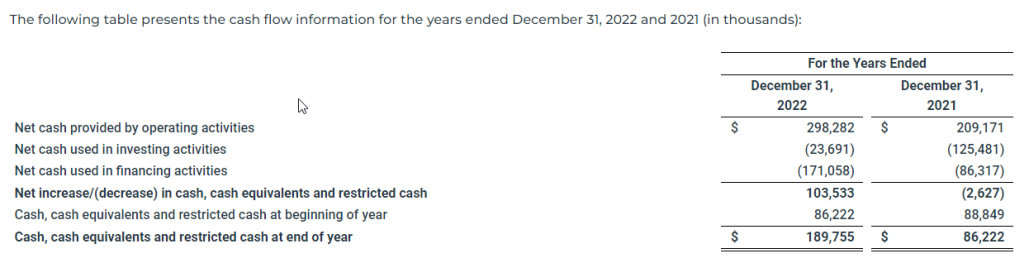
The increase in net cash provided by operating activities was primarily driven by a $63.1 million increase in net income due to higher freight rates as well as a $29.3 million net decrease in collateral on derivatives, primarily due to a decrease in the number and size of outstanding positions.
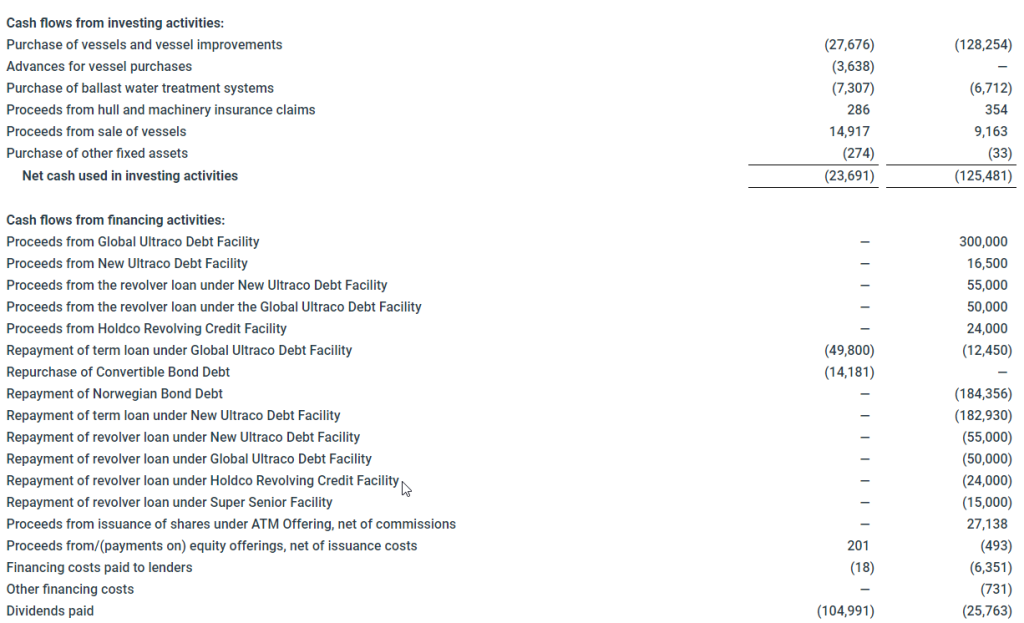
Net cash used in investing activities for the year ended December 31, 2022 was $23.7 million, compared to $125.5 million for the year ended December 31, 2021. During the year ended December 31, 2022, the Company paid $27.7 million to purchase one vessel and other vessel improvements, paid $7.3 million for the purchase of BWTS and paid $3.6 million as an advance on the purchase of one vessel. This use of cash was partially offset by $14.9 million in proceeds from the sale of one vessel and $0.3 million in proceeds received on hull and machinery claims. During the year ended December 31, 2021, the Company paid $128.3 million to purchase nine vessels and other vessel improvements and paid $6.7 million for the purchase of BWTS. This use of cash was partially offset by $9.2 million in proceeds from the sale of one vessel and $0.4 million of insurance proceeds received on hull and machinery claims.
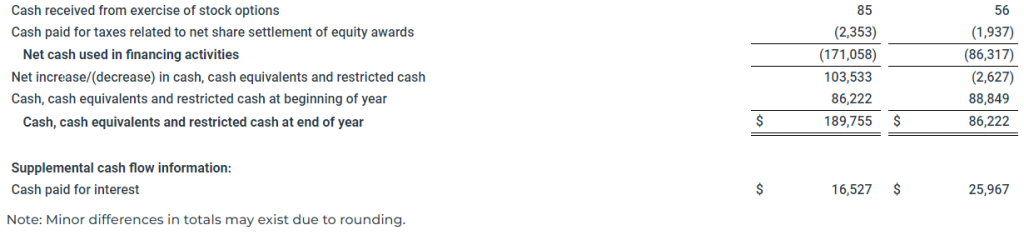
Net cash used in financing activities for the year ended December 31, 2022 was $171.1 million, compared to $86.3 million for the year ended December 31, 2021. During the year ended December 31, 2022, the Company (i) paid $105.0 million in dividends, (ii) repaid $49.8 million of term loan under the Global Ultraco Debt Facility, (iii) paid $14.2 million to repurchase $10.0 million in aggregate principal amount of Convertible Bond Debt and (iv) paid $2.4 million for taxes related to net share settlement of equity awards. During the year ended December 31, 2021, the Company repaid (i) $184.4 million of the Norwegian Bond Debt, (ii) $182.9 million of term loan under the New Ultraco Debt Facility (as defined herein), (iii) $55.0 million of revolver loan under the New Ultraco Debt Facility, (iv) $50.0 million of revolver loan under the Global Ultraco Debt Facility, (v) $24.0 million of the Holdco Revolving Credit Facility (as defined herein), (vi) $15.0 million of revolver loan under the Super Senior Facility and (vii) $12.5 million of term loan under the Global Ultraco Debt Facility. In addition, the Company paid (i) $25.8 million in dividends, (ii) $6.4 million in financing costs to lenders, (iii) $1.9 million for taxes related to net share settlement of equity awards, (iv) $0.7 million in other financing costs, and (v) $0.5 million of issuance costs related to equity offerings. These uses of cash were partially offset by (i) $300.0 million in proceeds from the term loan under the Global Ultraco Debt Facility, (ii) $55.0 million in proceeds from the revolver loan under the New Ultraco Debt Facility, (iii) $50.0 million in proceeds from the revolver loan under the Global Ultraco Debt Facility, (iv) $27.1 million in net proceeds from the ATM Offering (as defined herein), (v) $24.0 million in proceeds from the Holdco Revolving Credit Facility and (vi) $16.5 million in proceeds from the New Ultraco Debt Facility.
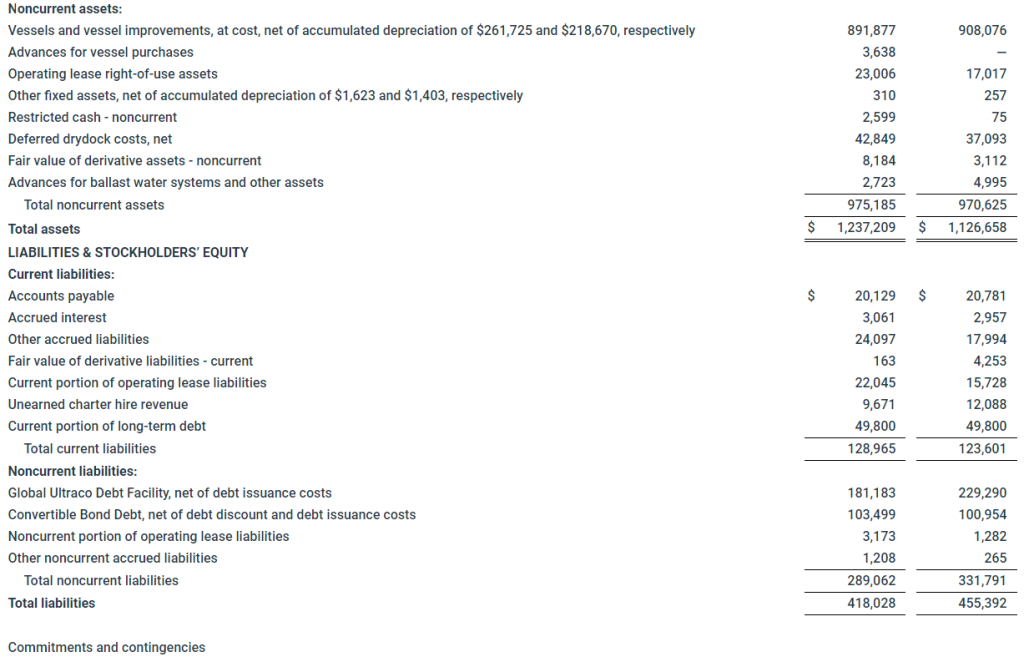
As of December 31, 2022, our cash and cash equivalents including noncurrent restricted cash was $189.8 million compared to $86.2 million as of December 31, 2021.
As of December 31, 2022, the Company’s debt, excluding $7.4 million of debt discount and debt issuance costs, was $341.9 million, the current portion of which was $49.8 million, and was comprised of $237.8 million outstanding under the Global Ultraco Debt Facility and $104.1 million of Convertible Bond Debt. In addition, as of December 31, 2022, the undrawn revolving facility under the Global Ultraco Debt Facility was $100.0 million.
Capital Expenditures and Drydocking
Our capital expenditures relate to the purchase of vessels and capital improvements to our vessels, which are required and/or expected to enhance the efficiency and/or safety of our vessels.
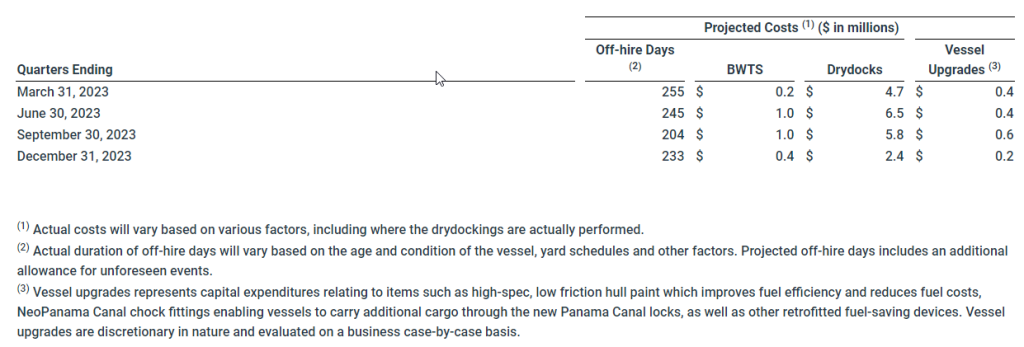
In addition to acquisitions that we may undertake in future periods, the Company’s other major capital expenditures include funding the Company’s program of regularly scheduled drydocking and vessel improvements necessary to comply with international shipping standards and environmental laws and regulations. Although the Company has some flexibility regarding the timing of its drydockings, the costs are relatively predictable. In accordance with statutory requirements, management anticipates that vessels are to be drydocked every five years for vessels less than 15 years and every two and a half years for vessels older than 15 years. Funding of drydocking costs is anticipated to be satisfied with cash from operations. Generally, drydocking requires us to reposition vessels from a discharge port to shipyard facilities, which will reduce our available days and operating days during that period.
The following table represents certain information about the estimated costs for anticipated vessel drydockings, BWTS and vessel upgrades in the next four quarters, along with the anticipated off-hire days:
Supplemental Information – Non-GAAP Financial Measures
This release includes various financial measures that are non-GAAP financial measures as defined under the rules of the Securities and Exchange Commission (“SEC”). We believe these measures provide important supplemental information to investors to use in evaluating ongoing operating results. We use these measures, together with accounting principles generally accepted in the United States (“GAAP” or “U.S. GAAP”) measures, for internal managerial purposes and as a means to evaluate period-to-period comparisons. However, we do not, and you should not, rely on non-GAAP financial measures alone as measures of our performance. We believe that non-GAAP financial measures reflect an additional way of viewing aspects of our operations, that when taken together with GAAP results and the reconciliations to corresponding GAAP financial measures that we also provide and provide a more complete understanding of factors and trends affecting our business. We strongly encourage you to review all of our financial statements and publicly-filed reports in their entirety and to not solely rely on any single non-GAAP financial measure.
Because non-GAAP financial measures are not standardized, it may not be possible to compare these financial measures with other companies’ non-GAAP financial measures, even if they have similar names.
Non-GAAP Financial Measures
(1) Adjusted net income and Basic and Diluted Adjusted net income per share
Adjusted net income and Basic and Diluted Adjusted net income per share represents Net income and Basic and Diluted net income per share, respectively, as adjusted to exclude unrealized gains and losses on FFAs and bunker swaps, gains and losses on debt extinguishment, and impairment of operating lease right-of-use assets. The Company utilizes derivative instruments such as FFAs and bunker swaps to partially hedge against its underlying long physical position in ships (as represented by owned and third-party chartered-in vessels). As the Company does not apply hedge accounting to these derivative instruments, unrealized mark-to-market gains and losses on forward hedge positions impact current quarter results, causing timing mismatches in the Consolidated Statements of Operations. Additionally, we believe that gains and losses on debt extinguishment and impairment of operating lease right-of-use assets are not representative of our normal business operations. We believe that Adjusted net income and Adjusted net income per share are more useful to analysts and investors in comparing the results of operations and operational trends between periods and relative to other peer companies in our industry. Our Adjusted net income should not be considered an alternative to net income/(loss), operating income/(loss), cash flows provided by/(used in) operating activities or any other measure of financial performance or liquidity presented in accordance with U.S. GAAP. As noted above, our Adjusted net income and Adjusted net income per share may not be comparable to similarly titled measures of another company because all companies may not calculate Adjusted net income in the same manner.
The following table presents the reconciliation of our Net income to Adjusted net income:
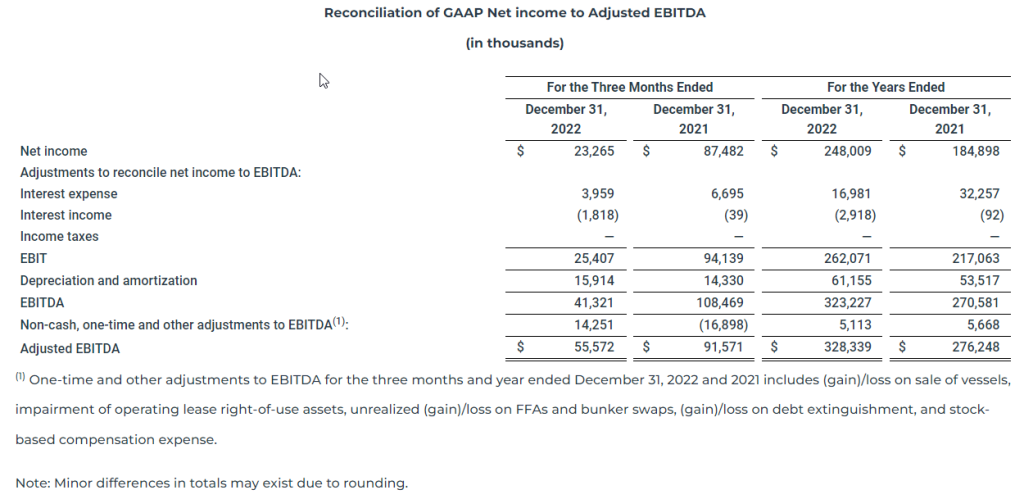
EBITDA and Adjusted EBITDA
We define EBITDA as Net income under GAAP adjusted for interest, income taxes and depreciation and amortization.
Adjusted EBITDA is a non-GAAP financial measure that is used as a supplemental financial measure by our management and by external users of our financial statements, such as investors, commercial banks and others, to assess our operating performance as compared to that of other peer companies in our industry, without regard to financing methods, capital structure or historical costs basis. Our Adjusted EBITDA should not be considered an alternative to net income/(loss), operating income/(loss), cash flows provided by/(used in) operating activities or any other measure of financial performance or liquidity presented in accordance with U.S. GAAP. Our Adjusted EBITDA may not be comparable to similarly titled measures of another company because all companies may not calculate Adjusted EBITDA in the same manner. Adjusted EBITDA represents EBITDA adjusted to exclude certain non-cash, one-time and other items that the Company believes are not indicative of the ongoing performance of its core operations such as vessel impairment, gain/(loss) on sale of vessels, impairment of operating lease right-of-use assets, unrealized (gain)/loss on FFAs and bunker swaps, (gain)/loss on debt extinguishment and stock-based compensation expense. The following table presents a reconciliation of our Net income to EBITDA and Adjusted EBITDA:
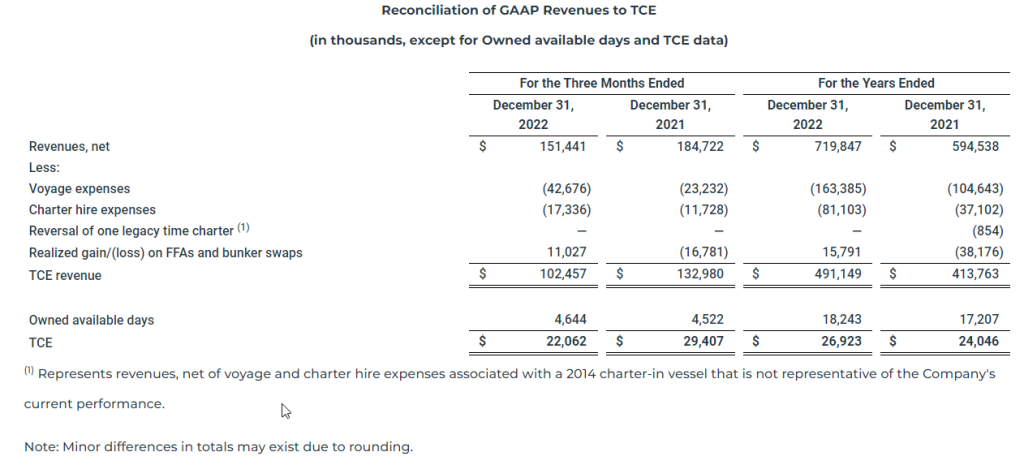
TCE revenue and TCE
Time charter equivalent revenue (“TCE revenue”) and time charter equivalent (“TCE”) are non-GAAP financial measures that are commonly used in the shipping industry primarily to compare daily earnings generated by vessels on time charters with daily earnings generated by vessels on voyage charters, because charter hire rates for vessels on voyage charters are generally not expressed in per-day amounts while charter hire rates for vessels on time charters generally are expressed in such amounts. The Company defines TCE revenue as revenues, net less voyage expenses and charter hire expenses, adjusted for realized gains and losses on FFAs and bunker swaps and defines TCE as TCE revenue divided by the number of owned available days. Owned available days is the number of our ownership days less the aggregate number of days that our vessels are off-hire due to vessel familiarization upon acquisition, repairs, vessel upgrades or special surveys. The shipping industry uses available days to measure the number of days in a period during which vessels should be capable of generating revenues. TCE provides additional meaningful information in conjunction with Revenues, net, the most directly comparable GAAP measure, because it assists Company management in making decisions regarding the deployment and use of its vessels and in evaluating their performance. Our TCE revenue and TCE should not be considered alternatives to net income/(loss), operating income/(loss), cash flows provided by/(used in) operating activities or any other measure of financial performance or liquidity presented in accordance with U.S. GAAP. Our TCE revenue and TCE may not be comparable to similarly titled measures of another company because all companies may not calculate TCE revenue and TCE in the same manner.
The following table presents the reconciliation of our Revenues, net to TCE:
Glossary of Terms:
Ownership days: We define ownership days as the aggregate number of days in a period during which each vessel in our fleet has been owned by us. Ownership days are an indicator of the size of our fleet over a period and affect both the amount of revenues and the amount of expenses that we record during a period.
Chartered-in days: We define chartered-in days as the aggregate number of days in a period during which we charter-in vessels under operating leases. Periodically, the Company charters in vessels on a single trip basis.
Available days: We define available days as the number of our ownership days and chartered-in days less the aggregate number of days that our vessels are off-hire due to vessel familiarization upon acquisition, repairs, vessel upgrades or special surveys. The shipping industry uses available days to measure the number of days in a period during which vessels should be capable of generating revenues.
Operating days: We define operating days as the number of available days in a period less the aggregate number of days that our vessels are off-hire due to any reason, including unforeseen circumstances. The shipping industry uses operating days to measure the aggregate number of days in a period during which vessels actually generate revenues.
Definitions of Capitalized Terms
ATM Offering: ATM Offering refers to an at market issuance sales agreement entered into in March 2021 by the Company with B. Riley Securities, Inc., BTIG, LLC and Fearnley Securities, Inc., as sales agents, to sell shares of common stock, par value $0.01 per share, of the Company with aggregate gross sales proceeds of up to $50.0 million, from time to time through an “at-the-market” offering program.
Convertible Bond Debt: Convertible Bond Debt refers to 5.0% Convertible Senior Notes due 2024 issued by the Company on July 29, 2019 that will mature on August 1, 2024.
Global Ultraco Debt Facility: Global Ultraco Debt Facility refers to the senior secured credit facility entered into by Eagle Bulk Ultraco LLC (“Eagle Ultraco”), a wholly-owned subsidiary of the Company, along with certain of its vessel-owning subsidiaries as guarantors, with the lenders party thereto (the “Lenders”), Credit Agricole Corporate and Investment Bank (“Credit Agricole”), Skandinaviska Enskilda Banken AB (PUBL), Danish Ship Finance A/S, Nordea Bank ABP, Filial I Norge, DNB Markets Inc., Deutsche Bank AG, and ING Bank N.V., London Branch. The Global Ultraco Debt Facility provides for an aggregate principal amount of $400.0 million, which consists of (i) a term loan facility in an aggregate principal amount of $300.0 million and (ii) a revolving credit facility in an aggregate principal amount of $100.0 million. The Global Ultraco Debt Facility is secured by 49 of the Company’s vessels. As of December 31, 2022, $100.0 million of the revolving credit facility remains undrawn.
Holdco Revolving Credit Facility: Holdco Revolving Credit Facility refers to the senior secured revolving credit facility for $35.0 million, by and among Eagle Bulk Holdco LLC (“Holdco”), a wholly-owned subsidiary of the Company, as borrower, the Company and certain wholly-owned vessel-owning subsidiaries of Holdco, as joint and several guarantors, the banks and financial institutions named therein as lenders and Credit Agricole, as lender, facility agent, security trustee and mandated lead arranger with Nordea Bank ABP, New York Branch. The Holdco Revolving Credit Facility was refinanced on October 1, 2021.
New Ultraco Debt Facility: New Ultraco Debt Facility refers to the senior secured credit facility for $208.4 million entered into by Ultraco Shipping LLC, a wholly-owned subsidiary of the Company, as the borrower (the “New Ultraco Debt Facility”), with the Company and certain of its indirectly vessel-owning subsidiaries, as guarantors (the “Guarantors”), the lenders party thereto, the swap banks party thereto, ABN AMRO Capital USA LLC (“ABN AMRO”), Credit Agricole, Skandinaviska Enskilda Banken AB (PUBL) and DNB Markets Inc., as mandated lead arrangers and bookrunners, and Credit Agricole Corporate and Investment Bank, as arranger, security trustee and facility agent. The New Ultraco Debt Facility was refinanced on October 1, 2021.
Norwegian Bond Debt: Norwegian Bond Debt refers to the Senior Secured Bonds issued by Eagle Bulk Shipco LLC, a wholly-owned subsidiary of the Company (“Shipco”), as borrower, certain wholly-owned vessel-owning subsidiaries of Shipco, as guarantors (“Shipco Vessels”), on November 28, 2017 for $200.0 million, pursuant to those certain Bond Terms, dated as of November 22, 2017, by and between Shipco, as issuer, and Nordic Trustee AS, a company existing under the laws of Norway (the “Bond Trustee”). The bonds outstanding under the Norwegian Bond Debt were repaid in full on October 18, 2021 after the expiry of the requisite notice period.
Super Senior Facility: Super Senior Facility refers to the credit facility for $15.0 million, by and among Shipco as borrower, and ABN AMRO, as original lender, mandated lead arranger and agent. During the third quarter of 2021, the Company cancelled the Super Senior Revolving Facility. There were no outstanding amounts under the facility.
Conference Call Information
As previously announced, members of Eagle’s senior management team will host a teleconference and webcast at 8:00 a.m. ET on Friday, March 3, 2023, to discuss the fourth quarter and full year results.
A live webcast of the call will be available on the Investor Relations page of the Company’s website at ir.eagleships.com. To access the call by phone, please register at https://register.vevent.com/register/BI4a067891a1ca404996653fa93931816e and you will be provided with dial-in details. A replay of the webcast will be available on the Investor Relations page of the Company’s website.
About Eagle Bulk Shipping Inc.
The Company is a U.S.-based, fully integrated shipowner-operator, providing global transportation solutions to a diverse group of customers including miners, producers, traders and end users. Headquartered in Stamford, Connecticut, with offices in Singapore and Copenhagen, Eagle focuses exclusively on the versatile midsize drybulk vessel segment and owns one of the largest fleets of Supramax/Ultramax vessels in the world. The Company performs all management services in-house (strategic, commercial, operational, technical, and administrative) and employs an active management approach to fleet trading with the objective of optimizing revenue performance and maximizing earnings on a risk-managed basis. For further information, please visit our website: www.eagleships.com.
Website Information
We intend to use our website, www.eagleships.com, as a means of disclosing material non-public information and for complying with our disclosure obligations under Regulation FD. Such disclosures will be included in our website’s Investor Relations section. Accordingly, investors should monitor the Investor Relations portion of our website, in addition to following our press releases, filings with the SEC, public conference calls, and webcasts. To subscribe to our e-mail alert service, please click the “Investor Alerts” link in the Investor Relations section of our website and submit your email address. The information contained in, or that may be accessed through, our website is not incorporated by reference into or a part of this document or any other report or document we file with or furnish to the SEC, and any references to our website are intended to be inactive textual references only.
Disclaimer: Forward-Looking Statements
Matters discussed in this release may constitute forward-looking statements that may be deemed to be “forward-looking statements” within the meaning of Section 27A of the Securities Act of 1933, as amended, Section 21E of the Securities Exchange Act of 1934, as amended, and the Private Securities Litigation Reform Act of 1995, and are intended to be covered by the safe harbor provided for under these sections. These statements may include words such as “believe,” “estimate,” “project,” “intend,” “expect,” “plan,” “anticipate,” and similar expressions in connection with any discussion of the timing or nature of future operating or financial performance or other events. Forward-looking statements in this release reflect management’s current expectations and observations with respect to future events and financial performance. Where we express an expectation or belief as to future events or results, including future plans with respect to financial performance, the payment of dividends and/or repurchase of shares, such expectation or belief is expressed in good faith and believed to have a reasonable basis. However, our forward-looking statements are subject to risks, uncertainties, and other factors, which could cause actual results to differ materially from future results expressed, projected, or implied by those forward-looking statements.
Where we express an expectation or belief as to future events or results, such expectation or belief is expressed in good faith and believed to have a reasonable basis. However, our forward-looking statements are subject to risks, uncertainties, and other factors, which could cause actual results to differ materially from future results expressed, projected or implied by those forward-looking statements. The principal factors that affect our financial position, results of operations and cash flows include market freight rates, which fluctuate based on various economic and market conditions, periods of charter hire, vessel operating expenses and voyage costs, which are incurred primarily in U.S. dollars, depreciation expenses, which are a function of the purchase price of our vessels and our vessels’ estimated useful lives and scrap value, general and administrative expenses, and financing costs related to our indebtedness. The accuracy of the Company’s assumptions, expectations, beliefs and projections depends on events or conditions that change over time and are thus susceptible to change based on actual experience, new developments and known and unknown risks. The Company gives no assurance that the forward-looking statements will prove to be correct and does not undertake any duty to update them. Our actual results may differ materially from those anticipated in these forward-looking statements as a result of certain factors which could include the following: (i) volatility of freight rates driven by changes in demand for seaborne transportation of drybulk commodities and in supply of drybulk shipping capacity; (ii) changes in drybulk carrier capacity driven by levels of newbuilding orders, scrapping rates or fleet utilization; (iii) changes in rules and regulations applicable to the drybulk industry, including, without limitation, regulations of the International Maritime Organization and the European Union (the “EU”), requirements of the Environmental Protection Agency and other governmental and quasi-governmental agencies; (iv) changes in U.S. and EU economic sanctions and trade embargo laws and regulations as well as equivalent economic sanctions laws of other relevant jurisdictions; (v) actions taken by regulatory authorities including, without limitation, the U.S. Treasury Department’s Office of Foreign Assets Control (“OFAC”); (vi) changes in the typical seasonal variations in drybulk freight rates; (vii) changes in national and international economic and political conditions including, without limitation, the current conflict between Russia and Ukraine, the current economic and political environment in China and the environment in historically high-risk geographic areas such as the South China Sea, the Indian Ocean, the Gulf of Guinea and the Gulf of Aden; (viii) changes in the condition of the Company’s vessels or applicable maintenance or regulatory standards (which may affect, among other things, our anticipated drydocking costs); (ix) the duration and impact of the novel coronavirus (“COVID-19”) pandemic and measures implemented by governments of various countries in response to the COVID-19 pandemic; (xi) volatility of the cost of fuel; (xii) volatility of costs of labor and materials needed to operate our business due to inflation; (xiii) any legal proceedings which we may be involved from time to time; and (xiv) other factors listed from time to time in our filings with the Securities and Exchange Commission (the “SEC”).
We have based these statements on assumptions and analyses formed by applying our experience and perception of historical trends, current conditions, expected future developments and other factors we believe are appropriate in the circumstances. The Company’s future results may be impacted by adverse economic conditions, such as inflation, deflation, or lack of liquidity in the capital markets, that may negatively affect it or parties with whom it does business. Should one or more of the foregoing risks or uncertainties materialize in a way that negatively impacts the Company, or should the Company’s underlying assumptions prove incorrect, the Company’s actual results may vary materially from those anticipated in its forward-looking statements, and its business, financial condition and results of operations could be materially and adversely affected.
Risks and uncertainties are further described in reports filed by Eagle Bulk Shipping Inc. with the SEC.
CONTACT
Frank De Costanzo
Chief Financial Officer
Eagle Bulk Shipping Inc.
Tel. +1 203-276-8100
Email: [email protected]
Source: Eagle Bulk Shipping Inc.


