Research, News, and Market Data on IPOOF
November 09, 2022 08:00 ET | Source: InPlay Oil Corp.
CALGARY, Alberta, Nov. 09, 2022 (GLOBE NEWSWIRE) — InPlay Oil Corp. (TSX: IPO) (OTCQX: IPOOF) (“InPlay” or the “Company”) announces its record setting financial and operating results for the three and nine months ended September 30, 2022 and the implementation of an inaugural base dividend. The implementation of the inaugural base dividend is a significant milestone in the Company’s strategy of providing additional strong returns to shareholders through the return of capital along with the generation of free adjusted funds flow (“FAFF”)(4) and top-tier light oil weighted production per share growth which has been made possible by the Company’s strong financial and operational position.
InPlay’s condensed unaudited interim financial statements and notes, as well as Management’s Discussion and Analysis (“MD&A”) for the three and nine months ended September 30, 2022 will be available at “www.sedar.com” and our website at “www.inplayoil.com”. An updated presentation will be posted to our website in due course.
Inaugural Base Dividend
InPlay is pleased to announce that its Board of Directors has approved the implementation of a base cash dividend of $0.015/share per month. The initial dividend is payable on November 30, 2022 to holders of the Company’s common shares of record at the close of business on November 18, 2022. The Company continues to make strong progress with respect to its debt reduction targets with a trailing 12 month net debt(2) to earnings before interest, taxes and depletion (“EBITDA”) ratio(4) of less than 0.4x at the end of the third quarter, which is forecast to be approximately 0.1x to 0.2x at year end (inclusive of the monthly base dividend). Any dividend payment after the initial one will be subject to the approval of InPlay’s Board of Directors at the time of declaration.
In determining the initial base dividend rate, InPlay’s Board of Directors took into account the Company’s strong balance sheet and the sustainability of the dividend in the event of a significant drop in commodity prices. In accordance with the recently released long term forecast, the Company projects that the base dividend is sustainable in a flat US$55/bbl WTI price environment in 2023 through 2025 with net debt to EBITDA levels remaining below 0.3x. Using forward strip pricing, as disclosed in our long term forecast announced on Sept 28, 2022 (which is approximately USD $5 – $7 per barrel lower than current WTI forward strip pricing), the Company is forecasting strong FAFF resulting in a build in our positive working capital balance (inclusive of capital expenditures and the monthly base dividend) to $91 – $98 million through the end of 2025 as outlined in greater detail in the “Outlook” section below. Over time, the Company anticipates that excess FAFF will be used for special dividends, share buybacks, tactical capital investment and strategic acquisitions.
The monthly cash dividend is expected to be designated as an “eligible dividend” for Canadian federal and provincial income tax purposes.
Third Quarter 2022 Financial & Operating Highlights
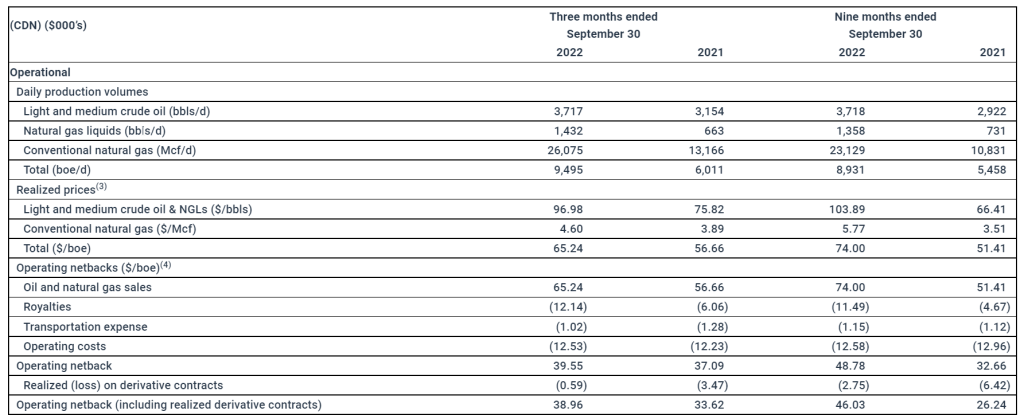
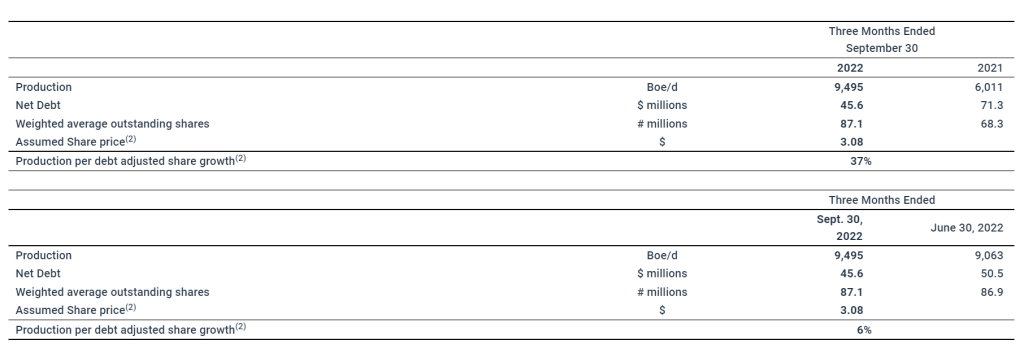
- Achieved record average quarterly production of 9,495 boe/d(1) (54% light crude oil and NGLs), an increase of 58% from third quarter production in 2021 of 6,011 boe/d(1) (64% light crude oil and NGLs) and an increase of 5% compared to our previous record of 9,063 boe/d(1) (57% light crude oil and NGLs) in the second quarter of 2022. Average production per weighted average basic share increased 24% compared to the third quarter of 2021 (37% on a debt adjusted(4) basis) and 4% compared to the second quarter of 2022 (6% on a debt adjusted basis).
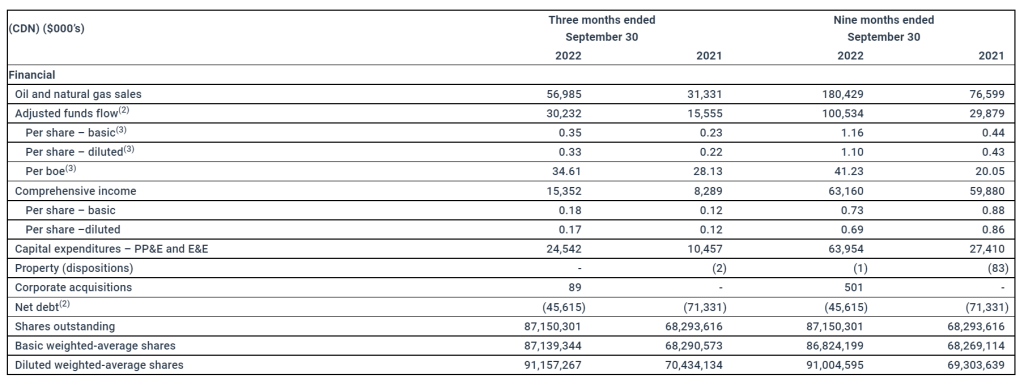
- Generated quarterly adjusted funds flow (“AFF”)(2) of $30.2 million ($0.35 per weighted average basic share(3)), an increase of 94% compared to $15.6 million ($0.23 per weighted average basic share) in the third quarter of 2021. On a year-to-date basis, generated AFF of $100.5 million ($1.16 per weighted average basic share(3)), an increase of 236% compared to $29.9 million ($0.44 per weighted average basic share) in 2021.
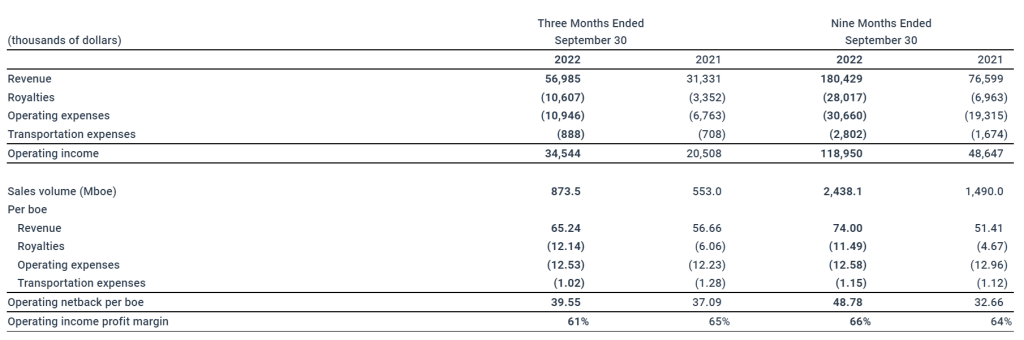
- Increased operating netbacks(4) on a year to date basis by 49% to $48.78/boe from $32.66/boe in 2021.
- Realized quarterly operating income(4) of $34.5 million, an increase of 68% compared to $20.5 million in the third quarter of 2021. On a year-to-date basis, realized quarterly operating income $119.0 million, an increase of 145% compared to $48.6 million in 2021.
- Maintained operating expenses at $12.53/boe compared to $12.23/boe in the third quarter of 2021 and $12.28/boe in the second quarter of 2022, despite rising costs of industry services as well as fuel and energy costs.
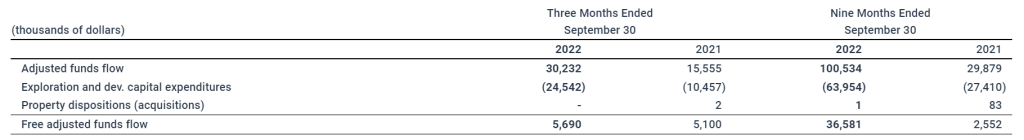
- Generated FAFF of $5.7 million resulting in a 10% reduction to net debt from June 30, 2022 with the majority of 2022 annual capital expenditures already incurred. Strong FAFF and resulting debt reductions are expected to accumulate throughout the fourth quarter (inclusive of the monthly base dividend).
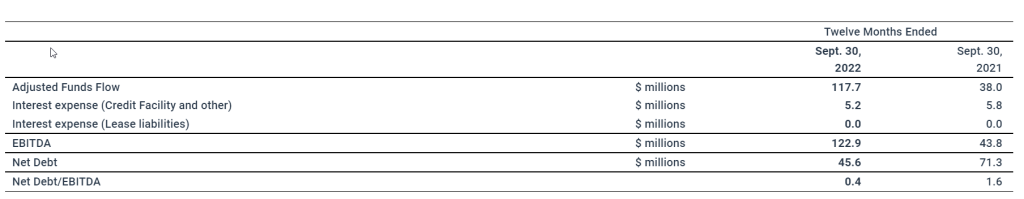
- Achieved a trailing twelve month net debt to EBITDA ratio of less than 0.4x to September 30, 2022 with a ratio of between 0.1x to 0.2x forecasted by year end (inclusive of the monthly base dividend).
- Realized net income of $15.4 million ($0.18 per basic share; $0.17 per diluted share). On a year-to-date basis, realized net income of $63.2 million ($0.73 per basic share; $0.69 per diluted share).
Financial and Operating Results
Third Quarter 2022 Financial & Operations Overview
Production averaged 9,495 boe/d(1) (54% light crude oil & NGLs) of sales in the third quarter of 2022, the sixth consecutive quarter that the Company has increased its quarterly production record. Quarterly production increased by 58% compared to 6,011 boe/d(1) (64% light crude oil & NGLs) in the third quarter of 2021 and 5% compared to 9,063 boe/d(1) (57% light crude oil & NGLs) in the second quarter of 2022, our previous quarterly record. This resulted in $30.2 million of AFF generated during the third quarter of 2022 and $5.7 million of FAFF which has reduced net debt levels by 10% to $45.6 million at September 30, 2022. On a year-to-date basis, the Company has generated AFF of $100.5 million and FAFF of $36.6 million resulting in a 43% reduction to net debt from December 31, 2021. Liquidity ratios to the end of the quarter continued to improve resulting in a trailing twelve month net debt to EBITDA ratio of less than 0.4x to September 30, 2022.
InPlay’s capital program for the third quarter of 2022 consisted of $24.5 million of capital expenditures. During the quarter, the Company completed and brought on production two (1.9 net) Extended Reach Horizontal (“ERH”) wells in Willesden Green that were drilled in the second quarter. Also in Willesden Green, the Company drilled, completed and brought on production three (2.9 net) ERH wells. Drilling operations were completed on an additional two (1.9 net) ERH wells in Willesden Green during the third quarter and these wells were brought on production in October. The Company also allocated capital to the construction of two Vapor Recovery Units which will increase gas conservation and reduce greenhouse gas emissions.
Efficient field operations and increased production levels allowed the Company to limit operating cost increases, achieving operating costs of $12.53/boe compared to $12.23/boe in the third quarter of 2021 and $12.28/boe in the second quarter of 2022. The Company continues to focus on operational efficiency and is proactive in reducing the impact of the inflationary pressures and supply chain disruptions that are impacting the oil and gas industry. This resulted in strong operating income and operating netbacks during the quarter of $34.5 million and $39.55/boe respectively.
Outlook
InPlay began its fourth quarter capital program drilling one (0.95 net) ERH well in Willesden Green which was brought on production in late October and is flowing without artificial lift and the start of drilling operations with our first two (2.0 net) Belly River wells. InPlay utilized the technologies and expertise developed in our Cardium play over the years to complete these Belly River drills in 5.4 and 5.6 days respectively. This was a dramatic improvement compared to our most recent two one-mile drilling operations in the area in 2016 averaging approximately 10 days per well and approximately 2.5 days quicker than recent one-mile wells drilled in the area by other operators.
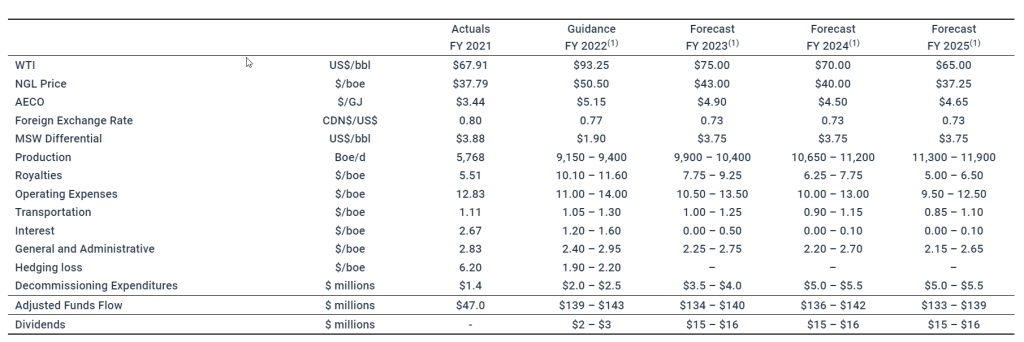
Given the continued strong operational results and positive future commodity prices, the Company reiterates its 2022 guidance and long-term forecast as released September 27, 2022 with the incorporation of the base dividend. The Company remains committed to providing top-tier production per share growth and a return of capital to shareholders. This base dividend and the recently implemented share buyback program in addition to our forecasted measured production per share growth places InPlay in a solid position to continue realizing on meaningful returns to shareholders over the long term.
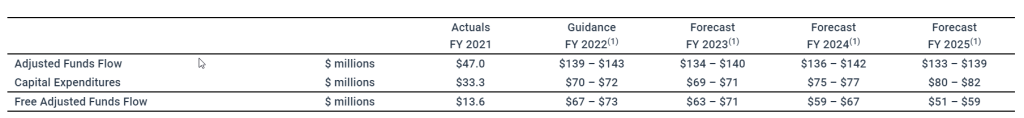
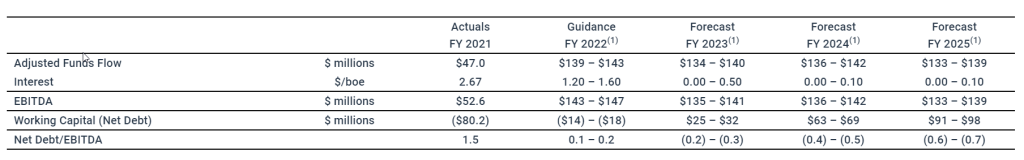
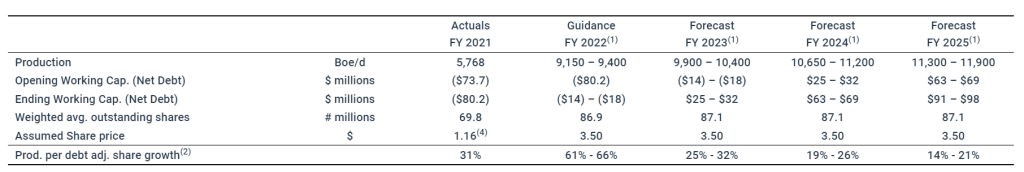
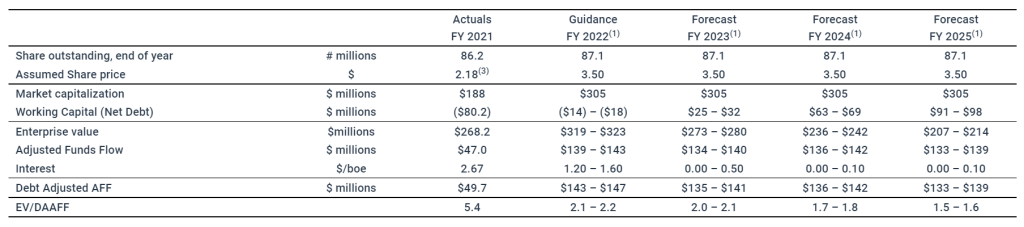
The table below reiterates the highlights of our 2022 guidance and long-term forecast at our current share price, including the impact of our inaugural base dividend:
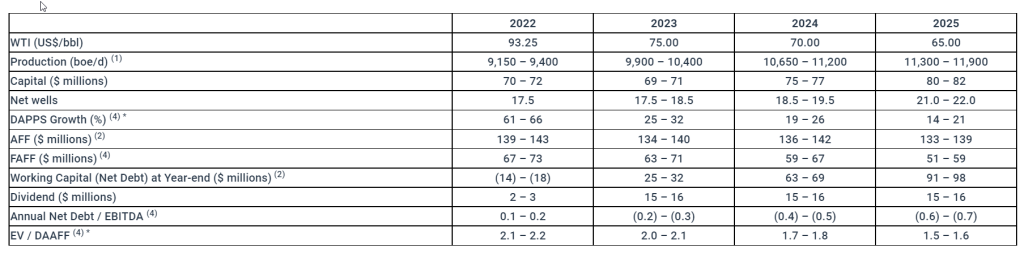
* Assumes a $3.50 share price
- The amounts above do not include potential future purchases through the Company’s normal course issuer bid (“NCIB”).
As outlined above in the long term forecast, the Company is forecasting to generate material FAFF resulting in a growing positive working capital balance through to 2025. Our strategy for the accumulating additional FAFF is to provide additional means for returns to shareholders through dividends, share buybacks, increased tactical capital investment and accretive strategic acquisitions.
InPlay is pleased to achieve this significant milestone of implementing our inaugural base dividend and would like to thank our employees, board members, lenders and shareholders for their support. The Company looks forward to releasing our 2023 budget outlining our capital program for the year in early January.
| Doug Bartole President and Chief Executive Officer InPlay Oil Corp. Telephone: (587) 955-0632 | Darren Dittmer Chief Financial Officer InPlay Oil Corp. Telephone: (587) 955-0634 |
Notes:
- See “Production Breakdown by Product Type” at the end of this press release.
- Capital management measure. See “Non-GAAP and Other Financial Measures” contained within this press release.
- Supplementary financial measure. See “Non-GAAP and Other Financial Measures” contained within this press release.
- Non-GAAP financial measure or ratio that does not have a standardized meaning under International Financial Reporting Standards (IFRS) and GAAP and therefore may not be comparable with the calculations of similar measures for other companies. Please refer to “Non-GAAP and Other Financial Measures” contained within this press release.
Reader Advisories
Non-GAAP and Other Financial Measures
Throughout this press release and other materials disclosed by the Company, InPlay uses certain measures to analyze financial performance, financial position and cash flow. These non-GAAP and other financial measures do not have any standardized meaning prescribed under GAAP and therefore may not be comparable to similar measures presented by other entities. The non-GAAP and other financial measures should not be considered alternatives to, or more meaningful than, financial measures that are determined in accordance with GAAP as indicators of the Company performance. Management believes that the presentation of these non-GAAP and other financial measures provides useful information to shareholders and investors in understanding and evaluating the Company’s ongoing operating performance, and the measures provide increased transparency and the ability to better analyze InPlay’s business performance against prior periods on a comparable basis.
Non-GAAP Financial Measures and Ratios
Included in this document are references to the terms “free adjusted funds flow”, “operating income”, “operating netback per boe”, “operating income profit margin”, “Net Debt to EBITDA” and “Debt adjusted production per share”. Management believes these measures and ratios are helpful supplementary measures of financial and operating performance and provide users with similar, but potentially not comparable, information that is commonly used by other oil and natural gas companies. These terms do not have any standardized meaning prescribed by GAAP and should not be considered an alternative to, or more meaningful than “profit (loss) before taxes”, “profit (loss) and comprehensive income (loss)”, “adjusted funds flow”, “capital expenditures”, “corporate acquisitions, net of cash acquired”, “net debt”, “weighted average number of common shares (basic)” or assets and liabilities as determined in accordance with GAAP as a measure of the Company’s performance and financial position.
Free Adjusted Funds Flow
Management considers FAFF an important measure to identify the Company’s ability to improve its financial condition through debt repayment and its ability to provide returns to shareholders. FAFF should not be considered as an alternative to or more meaningful than AFF as determined in accordance with GAAP as an indicator of the Company’s performance. FAFF is calculated by the Company as AFF less exploration and development capital expenditures and property dispositions (acquisitions) and is a measure of the cashflow remaining after capital expenditures before corporate acquisitions that can be used for additional capital activity, corporate acquisitions, repayment of debt or decommissioning expenditures or potentially return of capital to shareholders. Refer below for a calculation of historical FAFF and to the “Forward Looking Information and Statements” section for a calculation of forecast FAFF.
Operating Income/Operating Netback per boe/Operating Income Profit Margin
InPlay uses “operating income”, “operating netback per boe” and “operating income profit margin” as key performance indicators. Operating income is calculated by the Company as oil and natural gas sales less royalties, operating expenses and transportation expenses and is a measure of the profitability of operations before administrative, share-based compensation, financing and other non-cash items. Management considers operating income an important measure to evaluate its operational performance as it demonstrates its field level profitability. Operating income should not be considered as an alternative to or more meaningful than net income as determined in accordance with GAAP as an indicator of the Company’s performance. Operating netback per boe is calculated by the Company as operating income divided by average production for the respective period. Management considers operating netback per boe an important measure to evaluate its operational performance as it demonstrates its field level profitability per unit of production. Operating income profit margin is calculated by the Company as operating income as a percentage of oil and natural gas sales. Management considers operating income profit margin an important measure to evaluate its operational performance as it demonstrates how efficiently the Company generates field level profits from its sales revenue. Refer below for a calculation of operating income, operating netback per boe and operating income profit margin.
Net Debt to EBITDA
Management considers Net Debt to EBITDA an important measure as it is a key metric to identify the Company’s ability to fund financing expenses, net debt reductions and other obligations. EBITDA is calculated by the Company as adjusted funds flow before interest expense. When this measure is presented quarterly, EBITDA is annualized by multiplying by four. When this measure is presented on a trailing twelve month basis, EBITDA for the twelve months preceding the net debt date is used in the calculation. This measure is consistent with the EBITDA formula prescribed under the Company’s Senior Credit Facility. Net Debt to EBITDA is calculated as Net Debt divided by EBITDA. Refer below for a calculation of Net Debt to EBITDA and to the “Forward Looking Information and Statements” section for a calculation of forecast Net Debt to EBITDA.
Production per Debt Adjusted Share
InPlay uses “Production per debt adjusted share” as a key performance indicator. Debt adjusted shares should not be considered as an alternative to or more meaningful than common shares as determined in accordance with GAAP as an indicator of the Company’s performance. Debt adjusted shares is a non-GAAP measure used in the calculation of Production per debt adjusted share and is calculated by the Company as common shares outstanding plus the change in net debt divided by the Company’s current trading price on the TSX, converting net debt to equity. Debt adjusted shares should not be considered as an alternative to or more meaningful than weighted average number of common shares (basic) as determined in accordance with GAAP as an indicator of the Company’s performance. Management considers Debt adjusted share is a key performance indicator as it adjusts for the effects of capital structure in relation to the Company’s peers. Production per debt adjusted share is calculated by the Company as production divided by debt adjusted shares. Management considers Production per debt adjusted share is a key performance indicator as it adjusts for the effects of changes in annual production in relation to the Company’s capital structure. Refer below for a calculation of Production per debt adjusted share and to to the “Forward Looking Information and Statements” section for a calculation of forecast Production per debt adjusted share.

EV / DAAFF
InPlay uses “enterprise value to debt adjusted AFF” or “EV/DAAFF” as a key performance indicator. EV/DAAFF is calculated by the Company as enterprise value divided by debt adjusted AFF for the relevant period. Debt adjusted AFF (“DAAFF”) is calculated by the Company as adjusted funds flow plus financing costs. Enterprise value is a capital management measures that is used in the calculation of EV/DAAFF. Enterprise value is calculated as the Company’s market capitalization plus working capital (net debt). Management considers enterprise value a key performance indicator as it identifies the total capital structure of the Company. Management considers EV/DAAFF a key performance indicator as it is a key metric used to evaluate the sustainability of the Company relative to other companies while incorporating the impact of differing capital structures. Refer to the “Forward Looking Information and Statements” section for a calculation of forecast EV/DAAFF.
Capital Management Measures
Adjusted Funds Flow
Management considers adjusted funds flow to be an important measure of InPlay’s ability to generate the funds necessary to finance capital expenditures. AFF is a GAAP measure and is disclosed in the notes to the Company’s consolidated financial statements for the year ending December 31, 2021 and the most recently filed quarterly financial statements. All references to AFF throughout this document are calculated as funds flow adjusting for decommissioning expenditures and transaction and integration costs. This item is adjusted from funds flow as decommissioning expenditures are incurred on a discretionary and irregular basis and are primarily incurred on previous operating assets and transaction costs are non-recurring costs for the purposes of an acquisition, making the exclusion of these items relevant in Management’s view to the reader in the evaluation of InPlay’s operating performance. The Company also presents AFF per share whereby per share amounts are calculated using weighted average shares outstanding consistent with the calculation of profit (loss) per common share.
Net Debt / Working Capital
Net debt / working capital is a GAAP measure and is disclosed in the notes to the Company’s consolidated financial statements for the year ending December 31, 2021 and the most recently filed quarterly financial statements. The Company closely monitors its capital structure with a goal of maintaining a strong balance sheet to fund the future growth of the Company. The Company monitors net debt / working capital as part of its capital structure. The Company uses net debt / working capital (bank debt plus accounts payable and accrued liabilities less accounts receivables and accrued receivables, prepaid expenses and deposits and inventory) as an alternative measure of outstanding debt. Management considers net debt / working capital an important measure to assist in assessing the liquidity of the Company.
Supplementary Measures
“Average realized crude oil price” is comprised of crude oil commodity sales from production, as determined in accordance with IFRS, divided by the Company’s crude oil production. Average prices are before deduction of transportation costs and do not include gains and losses on financial instruments.
“Average realized NGL price” is comprised of NGL commodity sales from production, as determined in accordance with IFRS, divided by the Company’s NGL production. Average prices are before deduction of transportation costs and do not include gains and losses on financial instruments.
“Average realized natural gas price” is comprised of natural gas commodity sales from production, as determined in accordance with IFRS, divided by the Company’s natural gas production. Average prices are before deduction of transportation costs and do not include gains and losses on financial instruments.
“Average realized commodity price” is comprised of commodity sales from production, as determined in accordance with IFRS, divided by the Company’s production. Average prices are before deduction of transportation costs and do not include gains and losses on financial instruments.
“AFF per weighted average basic share” is comprised of AFF divided by the basic weighted average common shares.
“AFF per weighted average diluted share” is comprised of AFF divided by the diluted weighted average common shares.
“AFF per boe” is comprised of AFF divided by total production.
Forward-Looking Information and Statements
This news release contains certain forward–looking information and statements within the meaning of applicable securities laws. The use of any of the words “expect”, “anticipate”, “continue”, “estimate”, “may”, “will”, “project”, “should”, “believe”, “plans”, “intends”, “forecast”, “targets”, “framework” and similar expressions are intended to identify forward-looking information or statements. In particular, but without limiting the foregoing, this news release contains forward looking information and statements pertaining to the following: the Company’s business strategy, milestones and objectives including, without limitation, the Company’s forecast net debt to EBITDA ratio at year ended 2022; InPlay’s expectations regarding the sustainability of the base monthly dividend, including in the event of a drop in commodity prices; the projection that the dividend is sustainable in a flat $US 55/bbl WTI price environment; the expectation that the net debt to EBITDA ratio will continue to drop; the anticipated generation of strong FAFF through 2025 and our expected working capital balance; the expectation that additional FAFF will be used for special dividends, share buybacks, tactical capital investment and strategic acquisitions; the expectation of strong debt reductions in the fourth quarter of 2022; the expected results from the construction of the two Vapor Recovery Units; the anticipated timing of the release of the Company’s 2023 budget; expectations regarding future commodity prices; future oil and natural gas prices; future liquidity and financial capacity; future results from operations and operating metrics; future costs, expenses and royalty rates; future interest costs; the exchange rate between the $US and $Cdn; the anticipated tax treatment of the monthly base dividend; future development, exploration, acquisition, development and infrastructure activities and related capital expenditures, including our planned 2022 capital program and associated guidance and long-term forecast to 2025.
Without limitation of the foregoing, readers are cautioned that the Company’s future dividend payments to shareholders of the Company, if any, and the level thereof will be subject to the discretion of the Board of Directors of InPlay. The Company’s dividend policy and funds available for the payment of dividends, if any, from time to time, is dependent upon, among other things, levels of FAFF, leverage ratios, financial requirements for the Company’s operations and execution of its growth strategy, fluctuations in commodity prices and working capital, the timing and amount of capital expenditures, credit facility availability and limitations on distributions existing thereunder, and other factors beyond the Company’s control. Further, the ability of the Company to pay dividends will be subject to applicable laws, including satisfaction of solvency tests under the Business Corporations Act (Alberta), and satisfaction of certain applicable contractual restrictions contained in the agreements governing the Company’s outstanding indebtedness.
Forward-looking statements or information are based on a number of material factors, expectations or assumptions of InPlay which have been used to develop such statements and information but which may prove to be incorrect. Although InPlay believes that the expectations reflected in such forward looking statements or information are reasonable, undue reliance should not be placed on forward-looking statements because InPlay can give no assurance that such expectations will prove to be correct. In addition to other factors and assumptions which may be identified herein, assumptions have been made regarding, among other things: the impact of increasing competition; the general stability of the economic and political environment in which InPlay operates; the timely receipt of any required regulatory approvals; the ability of InPlay to obtain qualified staff, equipment and services in a timely and cost efficient manner; drilling results; the ability of the operator of the projects in which InPlay has an interest in to operate the field in a safe, efficient and effective manner; the ability of InPlay to obtain debt financing on acceptable terms; the timing and amount of purchases under the Company’s NCIB; the anticipated tax treatment of the monthly base dividend; field production rates and decline rates; the ability to replace and expand oil and natural gas reserves through acquisition, development and exploration; the timing and cost of pipeline, storage and facility construction and the ability of InPlay to secure adequate product transportation; future commodity prices; that various conditions to a shareholder return strategy can be satisfied; expectations regarding the potential impact of COVID-19 and the Russia/Ukraine conflict; currency, exchange and interest rates; regulatory framework regarding royalties, taxes and environmental matters in the jurisdictions in which InPlay operates; and the ability of InPlay to successfully market its oil and natural gas products. The forward-looking information and statements included herein are not guarantees of future performance and should not be unduly relied upon. Such information and statements, including the assumptions made in respect thereof, involve known and unknown risks, uncertainties and other factors that may cause actual results or events to defer materially from those anticipated in such forward-looking information or statements including, without limitation: the continuing impact of the COVID-19 pandemic and the Russia/Ukraine conflict; inflation and the risk of a global recession; changes in our planned 2022 capital program; changes in our approach to shareholder returns, including in relation to the Company’s NCIB and the timing and amount of any potential purchases thereunder; changes in commodity prices and other assumptions outlined herein; the risk that dividend payments may be reduced, suspended or cancelled; the potential for variation in the quality of the reservoirs in which we operate; changes in the demand for or supply of our products; unanticipated operating results or production declines; changes in tax or environmental laws, royalty rates or other regulatory matters; changes in development plans or strategies of InPlay or by third party operators of our properties; changes in our credit structure, increased debt levels or debt service requirements; inaccurate estimation of our light crude oil and natural gas reserve and resource volumes; limited, unfavorable or a lack of access to capital markets; increased costs; a lack of adequate insurance coverage; the impact of competitors; and certain other risks detailed from time-to-time in InPlay’s continuous disclosure documents filed on SEDAR including our Annual Information Form and our MD&A.
This press release contains future-oriented financial information and financial outlook information (collectively, “FOFI”) about InPlay’s financial and leverage targets and objectives, InPlay’s long-term forecast, and potential dividends and share buybacks, all of which are subject to the same assumptions, risk factors, limitations, and qualifications as set forth in the above paragraphs. The actual results of operations of InPlay and the resulting financial results will likely vary from the amounts set forth in this press release and such variation may be material. InPlay and its management believe that the FOFI has been prepared on a reasonable basis, reflecting management’s best estimates and judgments. However, because this information is subjective and subject to numerous risks, it should not be relied on as necessarily indicative of future results. Except as required by applicable securities laws, InPlay undertakes no obligation to update such FOFI. FOFI contained in this press release was made as of the date of this press release and was provided for the purpose of providing further information about InPlay’s anticipated future business operations and strategy. Readers are cautioned that the FOFI contained in this press release should not be used for purposes other than for which it is disclosed herein.
The internal projections, expectations, or beliefs underlying our Board approved 2022 capital budget and associated guidance, as well as management’s preliminary estimates and targets in respect of plans for 2023 and beyond, are subject to change in light of the impact of the COVID-19 pandemic, and any related actions taken by businesses and governments, ongoing results, prevailing economic circumstances, volatile commodity prices, and industry conditions and regulations. InPlay’s financial outlook and guidance provides shareholders with relevant information on management’s expectations for results of operations, excluding any potential acquisitions or dispositions, for such time periods based upon the key assumptions outlined herein. In this document reference is made to the Company’s longer range 2023 and beyond internal plan and associated economic model. Such information reflects internal targets used by management for the purposes of making capital investment decisions and for internal long range planning and budget preparation. Readers are cautioned that events or circumstances could cause capital plans and associated results to differ materially from those predicted and InPlay’s guidance for 2022, and more particularly 2023 and beyond, may not be appropriate for other purposes. Accordingly, undue reliance should not be placed on same.
The forward-looking information and statements contained in this news release speak only as of the date hereof and InPlay does not assume any obligation to publicly update or revise any of the included forward-looking statements or information, whether as a result of new information, future events or otherwise, except as may be required by applicable securities laws.
The key budget and underlying material assumptions used by the Company in the development of its 2022 guidance and long-term forecast including forecasted production, operating income, capital expenditures, AFF, FAFF, working capital (net debt), Net Debt/EBITDA, production per debt adjusted share and EV/DAAFF are as follows:
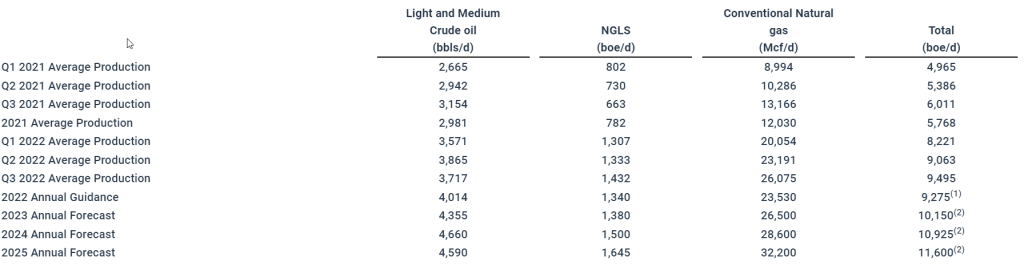
Production Breakdown by Product Type
Disclosure of production on a per boe basis in this press release consists of the constituent product types as defined in NI 51-101 and their respective quantities disclosed in the table below:
Notes:
- This reflects the mid-point of the Company’s 2022 production guidance range of 9,150 to 9,400 boe/d.
- This reflects the mid-point of the Company’s annual production forecast range.
- With respect to forward-looking production guidance, product type breakdown is based upon management’s expectations based on reasonable assumptions but are subject to variability based on actual well results.
References to crude oil, NGLs or natural gas production in this press release refer to the light and medium crude oil, natural gas liquids and conventional natural gas product types, respectively, as defined in National Instrument 51-101, Standards of Disclosure for Oil and Gas Activities (“Nl 51-101”).
BOE Equivalent
Barrel of oil equivalents or BOEs may be misleading, particularly if used in isolation. A BOE conversion ratio of 6 mcf: 1 bbl is based on an energy equivalency conversion method primarily applicable at the burner tip and does not represent a value equivalency at the wellhead. Given that the value ratio based on the current price of crude oil as compared to natural gas is significantly different than the energy equivalency of 6:1, utilizing a 6:1 conversion basis may be misleading as an indication of value.


