Research News and Market Data on SHIP

Other Highlights and Developments:
- Record first quarter net income of $10.2 million
- Cash dividends of $0.15 per share consisting of a quarterly cash dividend of $0.025 per share for Q1 2024 and a special cash dividend of $0.125 per share
- Total cash dividends of $1.60 per share, or $29.6 million, declared since March 2022
- Acquisition of two Japanese Capesize vessels, built in 2013 and 2012, with estimated deliveries in Q2 and H2 2024, respectively
- New financing and refinancing transactions of $58.3 million
ATHENS, Greece, May 15, 2024 (GLOBE NEWSWIRE) — Seanergy Maritime Holdings Corp. (“Seanergy” or the “Company”) (NASDAQ: SHIP), announced today its financial results for the first quarter ended March 31, 2024. The Company also declared a quarterly cash dividend of $0.025 per common share and a special cash dividend of $0.125 per common share for the first quarter of 2024.
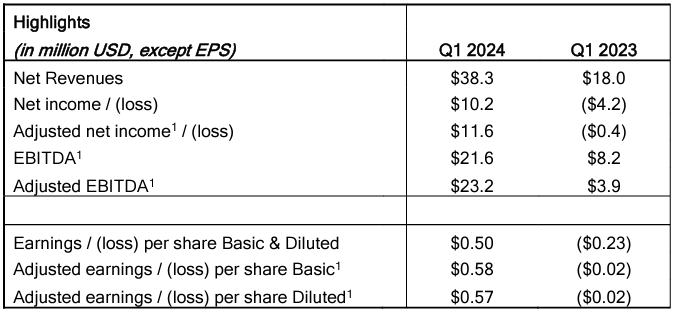
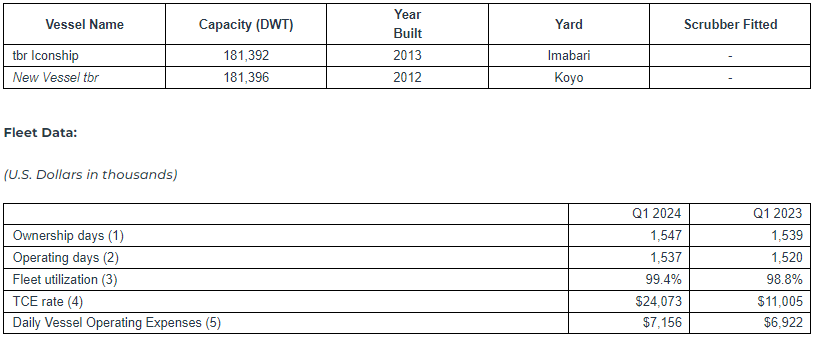
For the quarter ended March 31, 2024, the Company generated Net Revenues of $38.3 million, compared to $18.0 million in the first quarter of 2023. Net Income and Adjusted Net Income for the quarter were $10.2 million and $11.6 million, respectively, compared to Net Loss of $4.2 million and Adjusted Net Loss of $0.4 million in the first quarter of 2023. EBITDA and Adjusted EBITDA for the quarter were $21.6 million and $23.2 million, respectively, compared to $8.2 million and $3.9 million, respectively, for the same period of 2023. The daily Time Charter Equivalent (“TCE”2) of the fleet for the first quarter of 2024 was $24,073, compared to $11,005 in the same period of 2023.
Cash and cash-equivalents and restricted cash, as of March 31, 2024, stood at $24.2 million. Stockholders’ equity at the end of the first quarter was $240.6 million. Long-term debt (senior loans, finance lease liability and other financial liabilities) net of deferred charges stood at $223.2 million, while the book value of the fleet, including a chartered-in vessel and the advances for vessels acquisitions, was $442.0 million.
__________________________
1 Adjusted earnings / (loss) per share, Adjusted Net Income / (loss), EBITDA and Adjusted EBITDA are non-GAAP measures. Please see the reconciliation below of Adjusted earnings / (loss) per share, Adjusted Net Income / (loss), EBITDA and Adjusted EBITDA to net income, the most directly comparable U.S. GAAP measure.
2 TCE rate is a non-GAAP measure. Please see the reconciliation below of TCE rate to net revenues from vessels, the most directly comparable U.S. GAAP measure.
Stamatis Tsantanis, the Company’s Chairman & Chief Executive Officer, stated:
“We are pleased to report that in the first quarter of 2024 we achieved record profits on the back of the continuing positive momentum in the Capesize market. This was mainly driven by higher iron ore exports, healthy coal volumes, as well as certain geopolitical events.
“Seanergy generated a net income of $10.2 million, compared to a net loss of $4.2 million in the same period of 2023, as our fleet performed in line with the market with a daily time charter equivalent of approximately $24,000.
“In light of our strong performance and consistent with our commitment to rewarding our shareholders, our Board authorized paying a quarterly and special cash dividend of $0.15 per share. With these dividends, we have declared total cash dividends of $1.60 per share, or $29.6 million, since March 2022. Given the strong Capesize outlook, we are optimistic that we are well-positioned to continue executing on our clear corporate strategy, which entails rewarding our shareholders generously while growing and renewing our fleet.
“With regard to our guidance for the second quarter of 2024, based on current FFA levels, we expect our daily TCE to be equal to approximately $26,400, likely outperforming the Capesize market thanks to our proactive hedging strategy. Looking beyond that, for the second half of the year we have converted about 33% of our ownership days to a fixed daily rate of approximately $30,000. We remain vigilant on market developments and are keen to secure attractive daily rates that offer high returns on capital.
“Moving on to fleet developments since our last quarterly update, in March we agreed to acquire an additional Capesize vessel built in 2012 in Japan for a price of $35.6 million that we expect to fund through a combination of cash on hand and debt. Delivery is expected to take place in the second half of 2024, while we continue to evaluate opportunities to add high-performing ships to our fleet. Furthermore, we recently obtained credit committee approval from one of our close lending partners for a new sale and leaseback agreement to finance the previously announced acquisition of the M/V Iconship along with the refinancing of an existing facility at a considerably lower interest margin.
“To conclude with a brief market update, contrary to regular seasonality, the first quarter of 2024 was the strongest of the past decade for Capesize earnings. Brazilian iron ore exports rose about 12% year on year and were the highest since 2019, while coal seaborne trade remained at very high levels. The limited vessel orderbook of the past years seems to be contributing to a gradually improving supply and demand balance, while the geopolitical uncertainty related to the Red Sea crisis has also been marginally constructive for Capesize earnings. On a forward-looking note, the current orderbook suggests fleet growth of about 2% per year for 2025 and 2026, which will likely be surpassed by vessel demand growth according to most industry sources. Longer term, the commitment of major miners to future growth projects as well as the limits on fleet growth brought about by stricter environmental regulations are expected to lead to strong market conditions.
“Seanergy has proven its ability to execute on its fleet growth plan and with its high-quality vessels, strong balance sheet and successful commercial strategy, is well positioned to continue creating shareholder value.”
Company Fleet:

(1) The Company has the option to convert the index-linked rate to fixed for periods ranging between 1 and 12 months, based on the prevailing Capesize FFA Rate for the selected period.
(2) The latest redelivery date does not include any additional optional periods.
(3) The vessel is operated by the Company on the basis of a 12-month bareboat charter-in contract with the owners of the vessel, including a purchase option at the end of the bareboat charter.
Vessels to be delivered:

(1) Ownership days are the total number of calendar days in a period during which the vessels in a fleet have been owned or chartered in. Ownership days are an indicator of the size of the Company’s fleet over a period and affect both the amount of revenues and the amount of expenses that the Company recorded during a period.
(2) Operating days are the number of available days in a period less the aggregate number of days that the vessels are off-hire due to unforeseen circumstances. Available days are the number of ownership days less the aggregate number of days that our vessels are off-hire due to major repairs, dry-dockings, lay-up or special or intermediate surveys. Operating days include the days that our vessels are in ballast voyages without having finalized agreements for their next employment. The Company’s calculation of operating days may not be comparable to that reported by other companies.
(3) Fleet utilization is determined by dividing operating days by ownership days for the relevant period. Fleet Utilization is used to measure a company’s ability to efficiently find suitable employment for its vessels and minimize the number of days that its vessels are off-hire for unforeseen events. We believe it provides additional meaningful information and assists management in making decisions regarding areas where we may be able to improve efficiency and increase revenue and because we believe that it provides useful information to investors regarding the efficiency of our operations.
(4) TCE rate is defined as the Company’s net revenue less voyage expenses during a period divided by the number of the Company’s operating days during the period. Voyage expenses include port charges, bunker (fuel oil and diesel oil) expenses, canal charges and other commissions. The Company includes the TCE rate, which is not a recognized measure under U.S. GAAP, as it believes it provides additional meaningful information in conjunction with net revenues from vessels, the most directly comparable U.S. GAAP measure, and because it assists the Company’s management in making decisions regarding the deployment and use of our vessels and because the Company believes that it provides useful information to investors regarding our financial performance. The Company’s calculation of TCE rate may not be comparable to that reported by other companies. The following table reconciles the Company’s net revenues from vessels to the TCE rate.
(In thousands of U.S. Dollars, except operating days and TCE rate)

(5) Vessel operating expenses include crew costs, provisions, deck and engine stores, lubricants, insurance, maintenance and repairs. Daily Vessel Operating Expenses are calculated by dividing vessel operating expenses, excluding pre delivery costs, by ownership days for the relevant time periods. The Company’s calculation of daily vessel operating expenses may not be comparable to that reported by other companies. The following table reconciles the Company’s vessel operating expenses to daily vessel operating expenses.
(In thousands of U.S. Dollars, except ownership days and Daily Vessel Operating Expenses)

Earnings Before Interest, Taxes, Depreciation and Amortization (“EBITDA”) represents the sum of net income / (loss), Interest and finance costs, net, depreciation and amortization and income taxes, if any, during a period. EBITDA is not a recognized measurement under U.S. GAAP. Adjusted EBITDA represents EBITDA adjusted to exclude stock-based compensation, loss on forward freight agreements, net, loss on extinguishment of debt, and the gain on sale of vessel, which the Company believes are not indicative of the ongoing performance of its core operations.
EBITDA and adjusted EBITDA are presented as we believe that these measures are useful to investors as a widely used means of evaluating operating profitability. Management also uses these non-GAAP financial measures in making financial, operating and planning decisions and in evaluating the Company’s performance. EBITDA and adjusted EBITDA as presented here may not be comparable to similarly titled measures presented by other companies. These non-GAAP measures should not be considered in isolation from, as a substitute for, or superior to, financial measures prepared in accordance with U.S. GAAP.
Adjusted Net income / (loss) Reconciliation and calculation of Adjusted Earnings / (loss) Per Share
(In thousands of U.S. Dollars, except for share and per share data)

To derive Adjusted Net Income / (loss) and Adjusted Earnings / (loss) Per Share, both non-GAAP financial measures, from Net Income / (loss), we exclude non-cash items, as provided in the table above. We believe that Adjusted Net Income / (loss) and Adjusted Earnings / (loss) Per Share assist our management and investors by increasing the comparability of our performance from period to period since each such measure eliminates the effects of such non-cash items as stock based compensation, loss on extinguishment of debt and other items which may vary from year to year, for reasons unrelated to overall operating performance. In addition, we believe that the presentation of the respective measure provides investors with supplemental data relating to our results of operations, and therefore, with a more complete understanding of factors affecting our business than with GAAP measures alone. Our method of computing Adjusted Net Income / (loss) and Adjusted Earnings / (loss) Per Share may not necessarily be comparable to other similarly titled captions of other companies due to differences in methods of calculation.
Second Quarter 2024 TCE Guidance:
As of the date hereof, approximately 79% of the Company fleet’s expected operating days in the second quarter of 2024 have been fixed at an estimated TCE of approximately $27,115. Assuming that for the remaining operating days of our index-linked T/Cs, the respective vessels’ TCE will be equal to the average Forward Freight Agreement (“FFA”) rate of $24,200 per day (based on the FFA curve of April 29, 2024), our estimated TCE for the second quarter of 2024 will be approximately $26,4083. The following table provides the break-down of index-linked charter and fixed-rate charters in the second quarter of 2024:

3 This guidance is based on certain assumptions and there can be no assurance that these TCE estimates, or projected utilization will be realized. TCE estimates include certain floating (index) to fixed rate conversions concluded in previous periods. For vessels on index-linked T/Cs, the TCE realized will vary with the underlying index, and for the purposes of this guidance, the TCE assumed for the remaining operating days of the quarter for an index-linked T/C is equal to the average FFA rate of $24,200 based on the curve of April 29, 2024. Spot estimates are provided using the load-to-discharge method of accounting. The rates quoted are for days currently contracted. Increased ballast days at the end of the quarter will reduce the additional revenues that can be booked based on the accounting cut-offs and therefore the resulting TCE will be reduced accordingly.
First Quarter and Recent Developments:
Distribution of Q4 2023 Dividend and Declaration of Q1 2024 Dividends
On April 10, 2024, the Company paid a quarterly dividend of $0.025 per share and a special dividend of $0.075 per share, for the fourth quarter of 2023, to all shareholders of record as of March 25, 2024.
Continuing its quarterly dividend payments, the Company has declared a quarterly cash dividend of $0.025 per common share for the first quarter of 2024 payable on or about July 10, 2024 to all shareholders of record as of June 25, 2024. In addition, the Company has declared a special dividend of $0.125 per common share to all shareholders of record as of June 25, 2024 which will be paid on or about July 10, 2024.
At-The-Market Offering Program
Since the filing of the Company’s annual report, the Company has issued and sold 267,585 common shares at an average price of $9.67 per share, resulting in gross proceeds of $2.6 million under the up to $30.0 million “at-the-market” equity offering program initiated in December 2023 with B. Riley as sales agent.
As of May 13, 2024, the Company had 20,779,660 common shares issued and outstanding.
Vessel Transactions and Commercial Updates
Vessel Acquisitions
On February 5, 2024, the Company agreed to acquire a 181,392 dwt Capesize bulk carrier, built in 2013 in Japan, which will be renamed M/V Iconship. The purchase price of $33.7 million is expected to be funded through cash on hand and the AVIC Sale & leaseback agreement. The M/V Iconship is expected to be delivered to the Company within June 2024.
On March 18, 2024, the Company agreed to acquire a 181,396 dwt Capesize bulk carrier, built in 2012 in Japan. The purchase price of $35.6 million is expected to be funded through a combination of cash on hand and debt financing. The vessel is expected to be delivered to the Company between July and October 2024.
M/V Knightship – Time charter extension
In May 2024, the charterer of the M/V Knightship exercised the second optional period extending the time charter which will commence in December 2024. The extension period is for a minimum of 11 months to a maximum of 13 months, while all other main terms of the time charter remain the same.
Financing Updates
AVIC Sale & leaseback agreement
The Company obtained credit committee approval from one of its close lending partners for three separate sale and leaseback agreements of $58.3 million in aggregate to refinance the sale and leaseback agreements with CMBFL, secured by the M/Vs Hellasship and Patriotship, and to partially finance the acquisition of the M/V Iconship. The vessels will be sold and chartered back on a bareboat basis for a five-year period commencing on each delivery date. The Company will have continuous options to repurchase the vessels at predetermined prices at any time of the bareboat charter. At the end of the bareboat period, Seanergy will have the obligation to purchase the vessels for an aggregate amount of approximately $31.5 million. Each financing will bear interest of 3-month term SOFR plus 2.55% per annum. The new interest rate will be approximately 120 bps lower than the rate of the refinanced sale and leaseback agreements. In aggregate for the three vessels, the charterhire principals will amortize over twenty consecutive quarterly installments, averaging approximately $1.3 million per quarter. The agreements are subject to the completion of definitive documentation.
Conference Call:
The Company’s management will host a conference call to discuss financial results on May 15, 2024 at 10:00 a.m. Eastern Time.
Audio Webcast:
There will be a live, and then archived, webcast of the conference call available through the Company’s website. To listen to the archived audio file, visit our website, following the Webcasts & Presentations section under our Investor Relations page. Participants to the live webcast should register on the Seanergy website approximately 10 minutes prior to the start of the webcast, following this link.
Conference Call Details:
Participants have the option to register for the call using the following link. You can use any number from the list or add your phone number and let the system call you right away.