Image Credit: Brecht Bug (Flickr)
Worst Year for Stocks and Bonds Just Four Months to Recover
At two-thirds of the way through 2022, both stocks and bonds individually are having their worst performance in decades. For investors that have followed conventional wisdom and diversified with a 60/40 portfolio, the downside hasn’t really been offset by the asset mix. Equities and fixed income have never both been down this much, together, this late in the year. While real estate levels are still up, the most popular market index levels, often chosen for retirement savings, are making up for many good years in a row where they both climbed.
2022 Has Been a Bear
When interest rates rise, and you own a bond with lower interest rate payments or an entire fund of bonds during declining interest rates, those holdings are now not as valuable. Potential investors decide what they will pay for bonds, and this is the price that allows them to earn current rates (present value), not yesterday’s rates. And that provides a discounted or lower price for buyer and seller.
Obviously, this is very similar for stocks and stock funds; the current market price is the most you can get for your holdings, without regard to how much you paid. And since the first opening bell in 2022, rates have risen with a high reached on June 14, but with a renewed promise of what Chairman Powell called “pain” going forward in the bond market. Since his August address, where he used the “P” word twice, bond prices have resumed their orderly march downward. Year-to-date, the U.S. Treasury index is down 10.56%, and a high-grade corporate bond index (LQD) is down 15.79%.
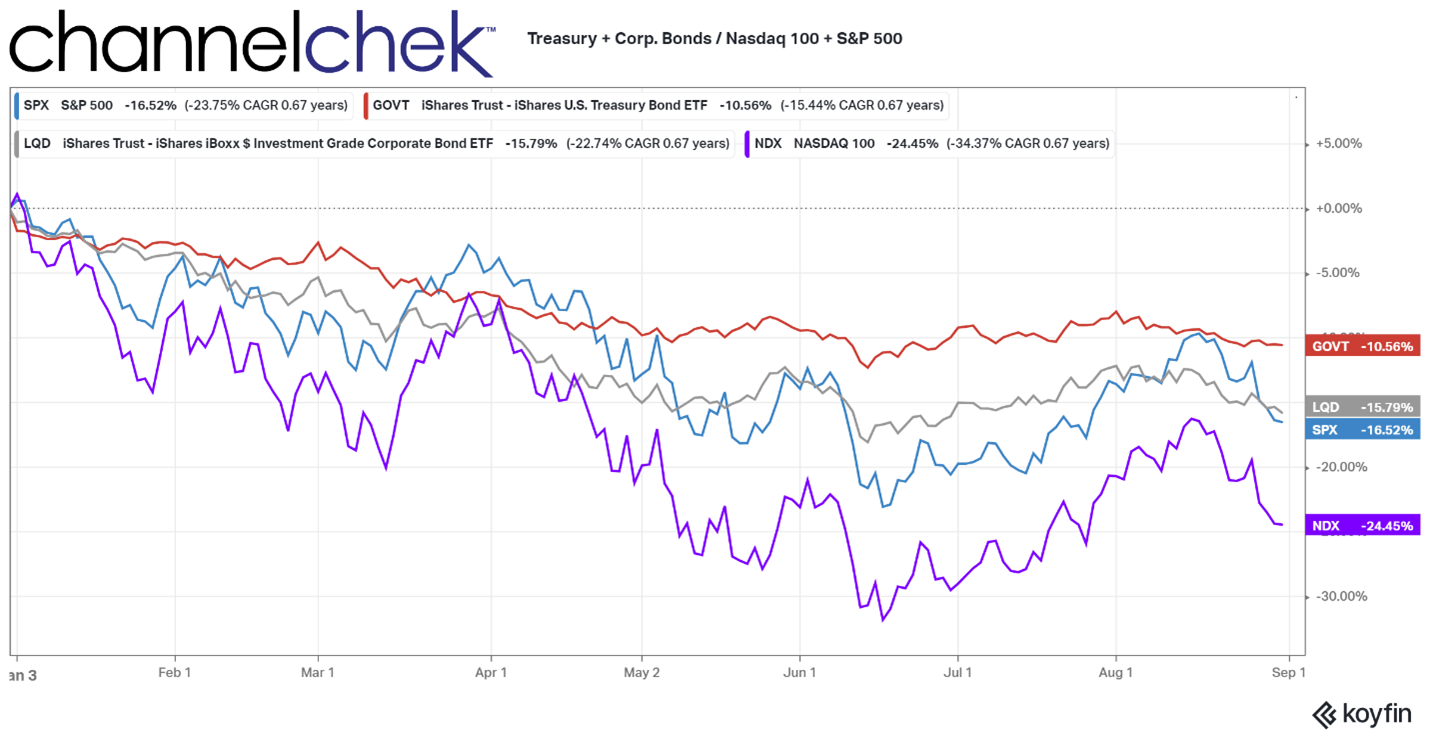
Source: Koyfin
Stocks have gone in the same downward direction this year. They tend to be faster and more volatile than bonds on the way up, and if you consider that, market interest rates have a theoretical floor of 0.00%, and potential gains for any bond are limited. With this, stocks are underperforming bonds negative returns. The S&P 500 has taken back 16.52% from investors since January, and the Nasdaq 100 is 50% worse than the S&P at a negative 24.45%.
Will this continue? Should investors maintain a 60/40 portfolio (60% stocks, 40% bonds)? Is it foolish to stay invested now?
Answers
As with most other investment forecasts, the true answer is that it can’t be known. But, what is known is the statistics of previous years. And from these stats, probabilities can be ballparked. Previous performance is no guarantee of future performance, but it truly is the best we have to go on. Even the 60/40 “ideal portfolio” was designed by looking backward and doing the math.
Looking back 50 years, there have only been three other years where both U.S. stocks and U.S. bonds (including government and corporate debt) were both in the red through August. The years were 1973, 1974 and 1981. In 2008 and 2015, U.S. Treasuries were green (flight to safety), while investment grade corporates were red with stocks.
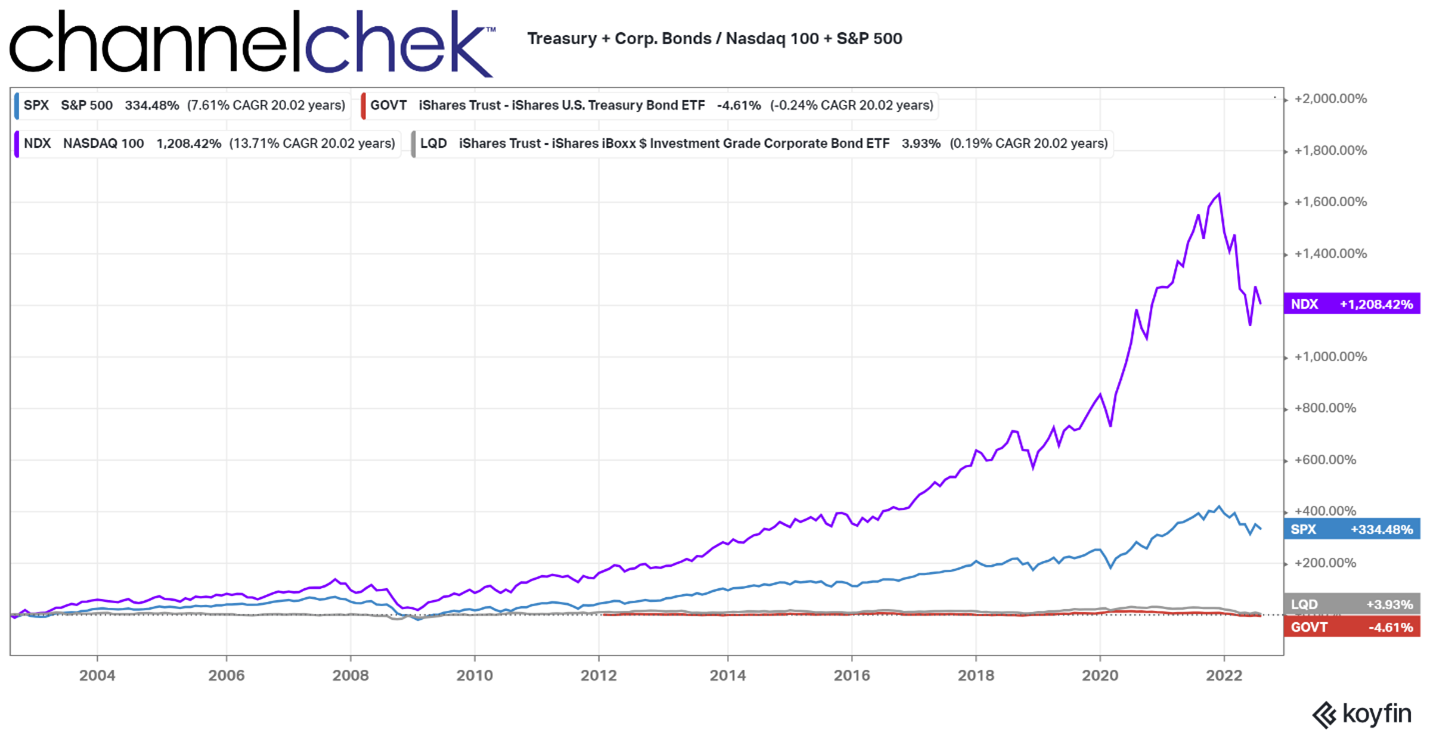
Source: Koyfin
According to an analysis by Bespoke Analytics, never have the year-to-date losses been as severe for both bonds and stocks simultaneously going into September. This is uncharted territory – it is thus far the worst year.
Unchartered Waters
There is no history to look back on. Any seasoned investor (or even boater) will advise when in unchartered waters, you navigate slowly and pay attention to the currents and crosscurrents.
One current that promises to continue is fewer and available
dollars
in the system for asset purchases and other investing. This is because the Fed has promised to increase its pace of quantitative
tightening beginning in September. The impact is $billions less direct investment in bonds and less money in the economy. The intent and likely impact of this is to push interest rates up, bonds down, and slow spending so demand more closely matches the supply of goods, services, and labor without pushing up prices.
Crosscurrents related to the Fed reducing money supply are that higher interest rates bring higher costs to businesses that tend to have high borrowing needs. Another crosscurrent is that investors who had moved into stocks because yields were near 1% may begin to find the new higher
yields attractive, even if, after inflation the investors are worse off. This would reduce the amount investors put in the stock market.
When Might Stocks Trend Upward?
Looking at the 20-year chart above, one might wonder why any investor with the ability to wait would invest any place but in the stock market. Nasdaq 100 is the big loser so far during the past eight months, along with the other stock indices, this year’s fall off is small compared to the growth over a longer time horizon. The probabilities would suggest this growth will continue at some point.
When will it continue upward? When there are more buyers than sellers. This happens when the people that have been holding on waiting for a turnaround finally give up. This could be soon, so much bad news is already known, and the idea of a recession (or continued recession) is already baked into prices. This has been the worst year ever through August for stocks and bonds. Bonds, it has been promised, are likely to continue down; for stocks it may be that the markets have been too negative and that brighter news than forecast is in store.
Managing Editor, Channelchek
Suggested Content

Why Interest Rates Will Keep Rising |

Money Supply Drives Stock Market Performance |

Powell Answered the Market’s Three Most Pressing Questions at Jackson Hole Symposium |

Is Michael Burry Frustrated that the Market Hasn’t Yet Crashed? |
Sources
Stay up to date. Follow us:
 |


