
Tuesday, January 17, 2022
Michael Kupinski, Director of Research, Noble Capital Markets, Inc.
Jacob Mutchler, Research Associate, Noble Capital Markets, Inc.
Refer to the bottom of the report for important disclosures
Overview:Will It Be A Happy New Year? The full impact of the recent increase in interest rates likely have not been fully reflected in the economy. But, many media stocks seem to anticipate that the industry is in a downturn now. Notably, some stocks have recently performed better and the current fundamentals are not falling off of a cliff.
Digital Media: Coming Off Of Its Sugar High? While Google now plans to phase out cookies in the second half of 2024, it is likely that the plan will affect 2023 as marketers and publishers prepare for the deprecation of cookies.
Television Broadcasting: A Watershed Year For Streaming. Streaming has now eclipsed both broadcast TV and cable TV in terms of viewing based on Nielsen data. Recently, Netflix launched a new pricing plan on November 3 which offers a basic tier, with advertising, at a low price point of $6.99. What does this mean for the TV industry?
Radio Broadcasting: Digital Is Bolstering Performance. It has been a bloodbath for Radio stocks, but the fundamentals appear better than the stock performance might suggest. Radio broadcasters with significant digital businesses are anticipated to report favorable pacings in Q1.
Publishing: You Are Golden If You Have Digital. The trouble with the largest newspaper company, Gannett, has created a pall over the group as it struggles to cut expenses. But, companies with substantial digital operations have performed well. We highlight one of our current favorites Lee Enterprises (LEE).
Overview
Will It Be A Happy New Year?
2022 was one of the worse for media stock performance in recent memory, with stocks across traditional and digital media sectors down over 40% or more. Media stocks underperformed the general market, as measured by the S&P 500 Index, which was down a more moderate 19.4% on a comparable basis for the full year 2022. It is typical for media stocks to underperform in a late-stage economic cycle or in the midst of an economic downturn. But, the significant stock declines are stunning. Macro-economic issues including inflation, rising interest rates, and the prospect of a looming economic downturn, all contributed to the poor performance.
The question is “will 2023 be better?” We believe so. There has been recent signs of life. The S&P 500 increased by 7% during the fourth quarter of 2022, marking the first time the Index had increased since fourth quarter of 2021. Notably, the Noble Publishing and Noble MarTech Indices outperformed the general market in the latest quarter. But, the full impact of the recent interest rate increase likely have not been reflected in the economy. Many media stocks seem to anticipate an economic downturn, but current fundamentals do not appear to be in a freefall and may be better than expected. If the economy further deteriorates from the recent or future rate hikes, it appears now that it may adversely affect the second half of 2023. Advertising pacings appear to be holding up well so far in the first half 2023. Notably, media stocks may begin to anticipate an improving economic outlook and overlook the weak fundamental environment in the second half.
Conventional thought anticipates that increasing concerns over an economic recession may prompt mortgage rates to trend lower in 2023. Furthermore, it is possible that the Fed may lower interest rates if inflation moderates, although the Fed is not currently anticipating rate decreases in 2023. Nonetheless, this paints a favorable picture for media stocks in 2023. Traditionally, the best time to buy media stocks is in the midst of an economic downturn. In addition, these consumer cyclical stocks tend to be among the first movers in an early-stage economic cycle and tend to perform well in a moderating interest rate environment. As mentioned earlier, the stocks may currently be oversold given the prospect that the current fundamental
environment is better anticipated.
What is the risk to this favorable outlook? We believe that the resurging Chinese economy may be disruptive. Within the last month, the China’s economy has been reopened from Covid lockdowns, which may put pressure on global energy prices. Such a prospect may make our fight on inflation more stubborn to combat, potentially throwing off our favorable outlook for moderating interest rates. In our view, we are closer to the light at the end of the tunnel than we were last year. Given the prospect that these stocks tend to outperform the market in an early stage economic recovery, we believe it is time for investors to accumulate positions in the media sectors. In this quarterly, we highlight some of our favorite plays in the Digital, Media & Technology space.
Digital Media & Technology
A Year To Forget
While there were signs of life in the fourth quarter of 2022 for the Internet and Digital Media sectors, 2022 was a year most investors in these sectors would like to forget. As Figure #1 LTM Internet & Digital Technology Performance illustrates, every one of these sectors substantially underperformed the S&P 500 last year. The S&P 500 Index finished the year down 19% which was substantially better than Noble’s Digital Media Index (-41%), MarTech Index (-52%), Social Media Index (-63%), and Ad Tech Index (-63%). Rather than focus on the stocks that significantly underperformed their respective Indices (and there are many), we would rather focus on the three stocks that finished 2022 up for the year.
The shares of one of our favorites, Harte Hanks (HHS) increased by 53% in 2022. The company continued its multi-year turnaround from a highly levered and unprofitable business (in 2019), to a double digit EBITDA margin business with a debt-free balance sheet. Furthermore, we believe that many of the company’s business lines have recession resilient qualities. The other stocks that performed well are Tencent (TME), whichincreased by 21%in 2022. Shares declined earlier in the year as China’s economy slowed as it maintained its Zero Covid-19 lockdowns, but surged in the fourth quarter as it appeared that the company would enjoy an increase in demand as China begins easing Covid restrictions. Finally, the shares of Perion Networks (PERI) increased by 5% in 2022 as Perion consistently beat expectation and raised its guidance throughout 2022. In the first week of 2023, the company once again pre-announced better than expected results for the fourth quarter, and shares are already up 14% since the start of the new year.
As Figure #2 Q4 Internet & Digital Technology Performancehighlights, there has been signs of life in Noble’s MarTech Index which increased 6%, roughly in-line with the market. In Noble’s MarTech Index, 11 of the 22 stocks in the index posted gains, led by Yext (YEXT; +46%), Shopify (SHOP; +29%), LiveRamp (RAMP; +29%) and Adobe (ADBE; +22%). This marks significant improvement from last quarter when only 4 of the sectors’ stocks finished the quarter in positive territory. MarTech stocks have suffered from a market reset to revenue multiples that began when the Fed began raising rates. MarTech share price declines in the first, second and third quarters of 2022 were mostly driven by multiple compression as investors rotated out of high-flying tech sectors where companies had chased growth at all costs (at the expense of profitability). Only 7 of the MarTech companies in the Index posted positive EBITDA in the latest quarter. Laggards during the fourth quarter were Noble’s Digital Media Index (-5%), Social Media Index (-7%) and Ad Tech Index (-20%).
Coming Off Of A Sugar High?
One of the largest issues affecting the Digital Media industry in 2023 will be the phase out of the use of third-party cookies. Cookies were used to track a user visits on internet sites and that data was used to model behavior. The industry has moved away from the use of cookies as governments and consumers have raised concerns over privacy issues and as consumers wanted more control over how their data is used. Governments have taken a more active role in protecting consumer privacy. California, Colorado, Connecticut, Utah, and Virginia have passed privacy laws. It is likely that there will be a federal privacy law at some point.
How will this affect the industry? We believe that there has been plenty of time to “work around” this issue. The implementation of the phase out of cookies has been delayed several times, originally announced by Google in 2020. Google now plans to phased out cookies in the second half of 2024, if it is not delayed again. As marketers and publishers prepare for the deprecation of cookies, digital advertising likely will be begin to affect 2023.
Digital Advertising Outlook for 2023
Last October eMarketer revised lower its 2023 U.S. digital advertising forecast by $5.5 billion, from $284.1 billion to $278.6 billion. While this sounds like a substantial drop in percentage terms, the 2023 guidance was lowered from 14% growth to 12% growth. Most of the global ad agencies expect digital to continue to grow by double digits driven with dollars migrating to such digital ad channels as retail media and connected TV. Both sectors continue to demonstrate impressive growth.
Retail Media – A retail media network is a retailer-owned advertising service that allows marketers to purchase advertising space across all digital assets owned by a retail business, using the retailer’s first-party data to connect with shoppers throughout the buying journey. eMarketer forecasts that retail media ad spending grew by 31% last year to $41 billion and will grow to $61 billion over the next two years, by which time it will equate to 20% of digital advertising. The leaders in retail media are Amazon, Walmart and Instacart.
Through a retail media network, partners (advertisers) get direct access to a retailer’s customers. The benefit to the partners/advertisers is that they get access to first party data. Retailers own and store this data and allow advertisers to access them through their retail media programs. The first party data is valuable because it is collected at the point of sale allowing brands to get better insights into purchase behavior. Traditional retailers are beginning to follow suit. Traditional retailers with the largest digital audiences (per comScore) are Walmart, Target, Home Depot, Lowes, CVS, Walgreens, Costco and Kohls.
On January 10th, Microsoft announced that it intended to create the industry’s most complete omnichannel retail media technology stack supported by its Promote IQ platform, a company Microsoft acquired in 2019. We expect companies that serve the retail media sector from an Ad Tech or Mar Tech standpoint are poised to benefit from secular trends in this sector.
Connected TV (CTV) – Last July, Nielsen announced that for the first time U.S. streaming TV viewership was larger than cable TV viewing. In July 2022, eMarketer forecast that CTV advertising would reach $18.9 billion in 2022. However, in October 2022, eMarketer raised its forecast for CTV advertising by $2.3 billion to $21.2 billion in 2022. In October, the forecaster also raised its 2023 CTV advertising forecast by $3 billion to $26.9 billion, up from $23.9 billion in the July 2022 forecast. The big increase is due primarily to Netflix and Disney+ announcing they were launching ad supported tiers to their streaming offerings. Ad Tech or Mar Tech companies that serve this market are also poised to benefit from secular viewing trends and the advertising dollars that are migrating to these platforms, discussed later in this report.
The ability to target specific audiences and measure specific outcomes tied to the ads that viewers watched, has made CTV a force to be reckoned with, particularly for those advertisers that are never quite sure which advertising mediums provide the highest returns. Historically, TV was a mass medium used by large brands that wanted massive reach. CTV has opened the door to a wider variety of advertisers that are looking to reach more targeted, even niche, audiences. According to MNTN, a connected TV performance marketing platform, many CTV advertisers are first-time TV advertisers. With new FAST (Free Ad-Supported Streaming TV) channels coming online every month, there is no shortage of supply coming to market. This is just one reason why eMarketer predicts CTV advertising to grow by $10+ billion over the next two years and reach nearly $32 billion in advertising revenue in 2024.
As we look toward 2023, our current favorites include Harte Hanks (HHS) and Direct Digital (DRCT). In terms of Harte Hanks, we believe that the company has recession resilient qualities and that the company’s balance sheet is in a sound position. Furthermore, given the recent rising interest rate environment, the company’s unfunded pension liabilities have dramatically improved. The company may have the opportunity to further mitigate its pension liabilities in 2023. Figure #3 Marketing Tech Comparables highlights, the shares of HHS are trading well below its peers. We believe that there is meaningful upside potential in the shares as it closes the valuation gap with its peers.
While the deprecation of cookies has created a pall over the sector, we believe that Direct Digital has worked with its Publishers to mitigate this issue. In addition, the company is a relatively small player in a very large marketplace. As such, we believe that the company has the ability to attractively grow in 2023. In our view, the shares appear to be oversold given the continuation of favorable advertising trends. Figure #4 Advertising Tech Comparables illustrates that the DRCT shares trade below the average valuation in its Advertising Marketing peer set. In our view, the valuation should be higher than the averages given that the company has leading industry revenue growth. Closing this valuation gap offers compelling stock appreciation potential.
Figure #1 LTM Internet & Digital Technology Performance
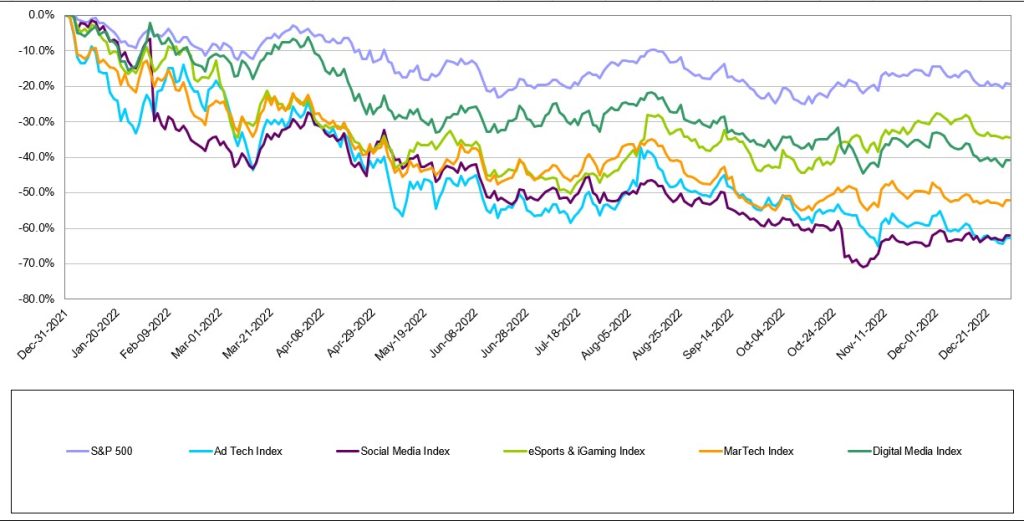
Source: Capital IQ
Figure #2 Q4 Internet & Digital Technology Performance
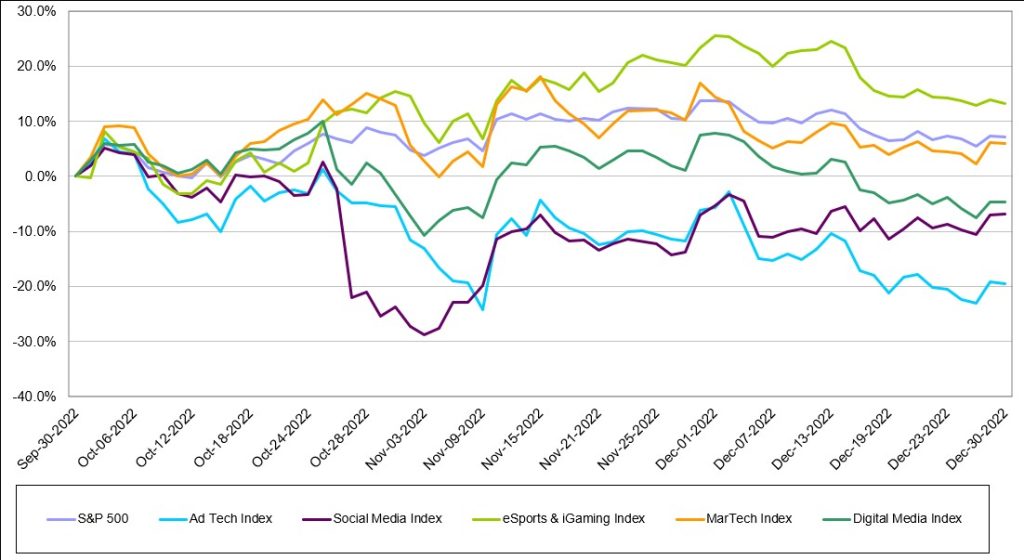
Source: Capital IQ
Marketing Technology
Figure #3 Marketing Tech Comparables
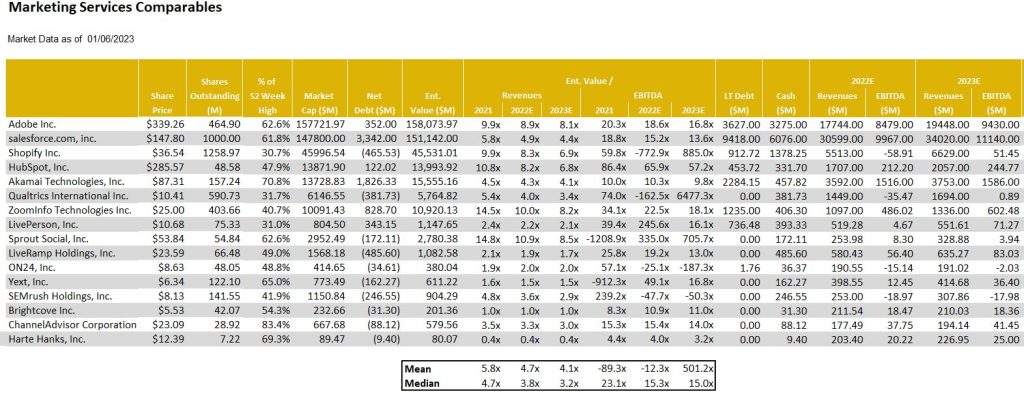
Source: Eikon, Company filings and Noble estimates
Figure #4 Advertising Tech Comparables
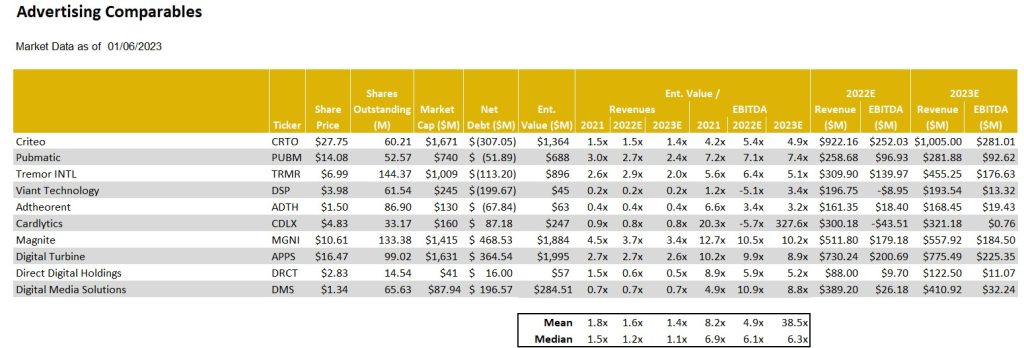
Source: Eikon, Company filings and Noble estimates
Traditional Media
Another Quarter Of Moderating Stock Performance
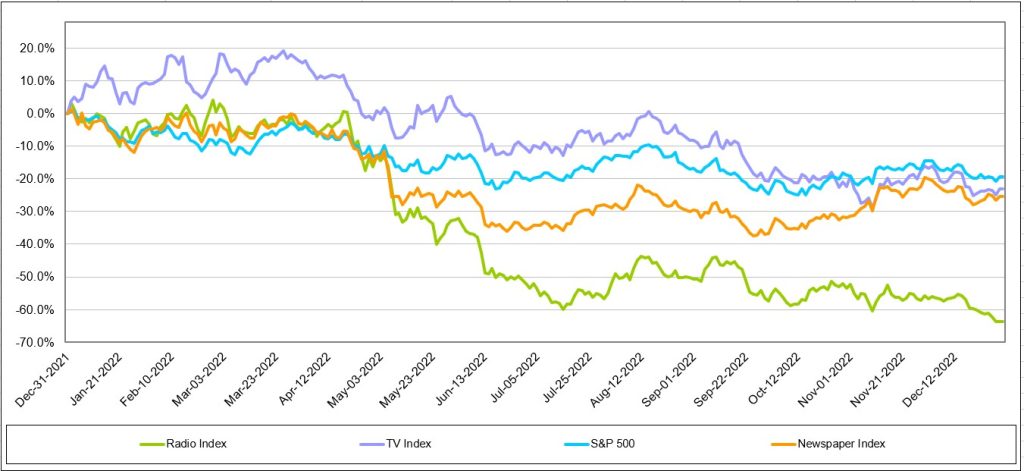
Traditional media stocks underperformed the general market in 2022, with the Radio sector the hardest hit. As Figure #5 LTM Traditional Media Performance Chart illustrates, the Noble Radio Index declined 63.8% versus 19.4% for the general market, as measured by the S&P 500, in a comparable time period. Television and Publishing stocks were down 23.2% and 25.4%, respectively, more in line with the general market returns. But, there were notable company stock performance disparities within each sector, highlighted later in this report. Larger market capitalized companies performed better, which skewed the market cap weighted Indices.
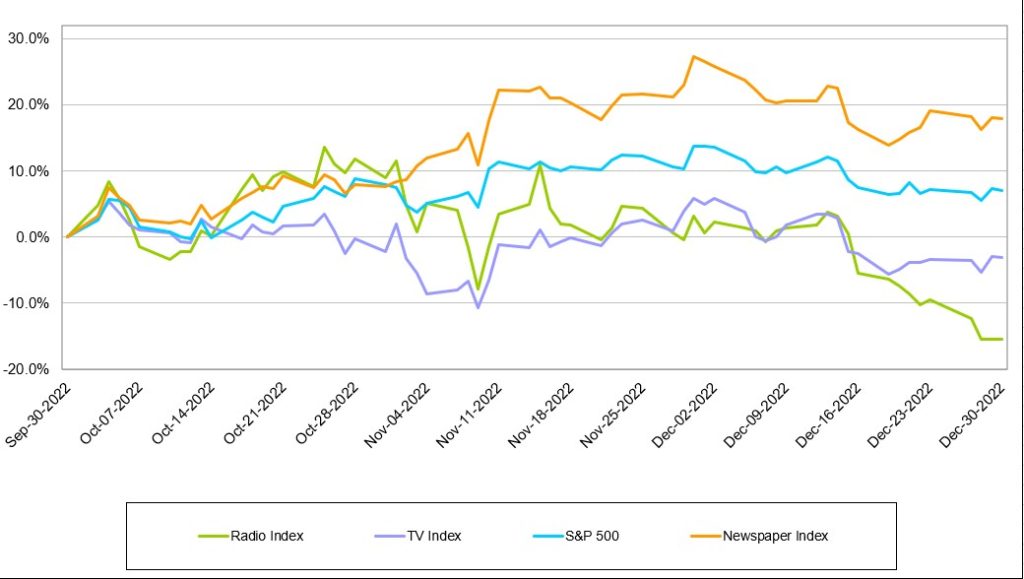
The traditional media stocks seemed to have stabilized from the rapid declines earlier in the year. Possible signs of life in the traditional media sector as well? As Figure #6 Q4 Traditional Media Performance highlights, the Publishing sector once again outperformed the general market in the quarter. The Noble Television Index declined 3.2%, but this decline moderated from the 10.1% decline in the third quarter. The Radio industry still has not yet stabilized, with the Noble Radio Index down 15.4% in the latest quarter.
Figure #5 LTM Traditional Media Performance
Source: Capital IQ
Figure #6 Q4 Traditional Media Performance
Source: Capital IQ
Television Broadcast
Will Netflix suck the air out of the room?
Netflix launched a new pricing plan on November 3 which offers a basic tier, with advertising, at a low price point of $6.99. This compares with its previous tiers of $9.99 and $19.99 for advertising free streaming. While reports indicate that the advertising platform is off to a slow start, we believe that the Netflix move could be disruptive to the Broadcast Television Network business as its lower price basic service gains traction. It is likely that there will be some cannibalization from its higher pricing tier, but we believe that the move will broaden its subscriber base. While Netflix has not considered offering live sports on its streaming platform given the cost of sports rights, we believe that the potential success of its subscription/advertising tier may provide a platform to upend that decision. There is a strong tailwind for viewership trends on streaming platforms, which now exceed that of broadcast television viewing. A decision to enter sports will be a big deal and disruptive to Network broadcasting.
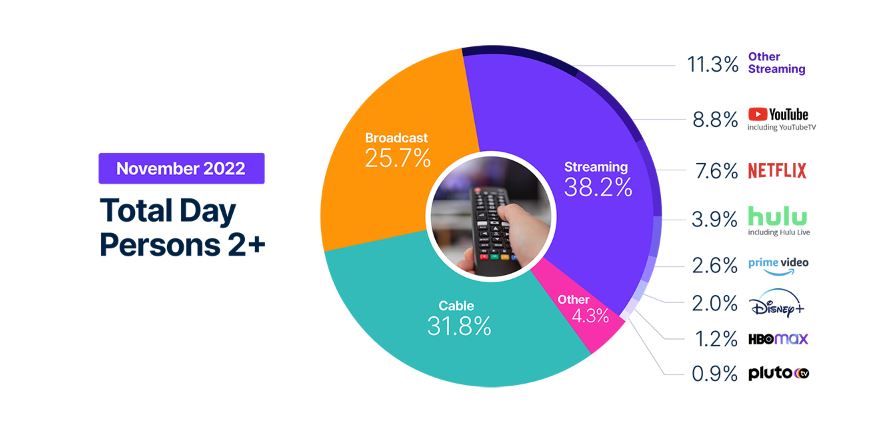
Streaming viewership not only eclipsed television viewing in July 2022, but also that of cable viewing, 34.8% versus 34.4%. In addition, based on the latest Nielsen data from November 2022, streaming now accounts for 38.2% of total viewing with Broadcast at 25.7% and cable at 31.8%. Figure #7 Viewership illustrates the November viewership data. While TV viewership increased 7.8% in November, largely due to sports content, streaming usage year over year was up more than 41%.
Figure #7 Viewership
Source: Nielsen Media Insights
Scripps Plans To Expand Sports
The declining cable subscriptions and cable viewership, especially on regional sports networks, led E.W. Scripps to launch a new Scripps Sports division. This division plans to seek broadcast rights from teams and leagues and bring that programming to broadcast television. The company plans to obtain rights either in local TV markets where it can partner with the the teams or on a national basis, utilizing its distribution on its Ion Network. It is important to note that ION is unique from other networks. Ion’s distribution is nearly 100% of the US television market given that it has local licenses and local towers in every market, it is fully distributed on cable and satellite, and is offered over the air. As such, we believe that Scripps offers a unique proposition to sports teams interested in building its audiences.
Will ATSC 3.0 Stream The Tide?
Furthermore, the broadcast industry appears to be more aggressively ramping its own streaming capabilities with the rollout of its new broadcast standard, ATSC 3.0. ATSC 3.0 is built on the same Internet Protocol as other streaming platforms, and, as such, broadcast programming and internet content can be accessible in the car, on mobile devices, as well as in the home. Importantly, the new standard can handle signal shifting, like if you were moving in a car, and the signal is more robust so you may be able to pick up more stations in a local market. While there are many opportunities for the new standard, services and offerings are still being developed. But, it offers promising opportunities for broadcasters to compete with streaming services in the future. We expect that the industry will make more announcements about this promising technology at future events, including the upcoming NAB Show, April 16-19 in Las Vegas, NV.
Are We In A Recession?
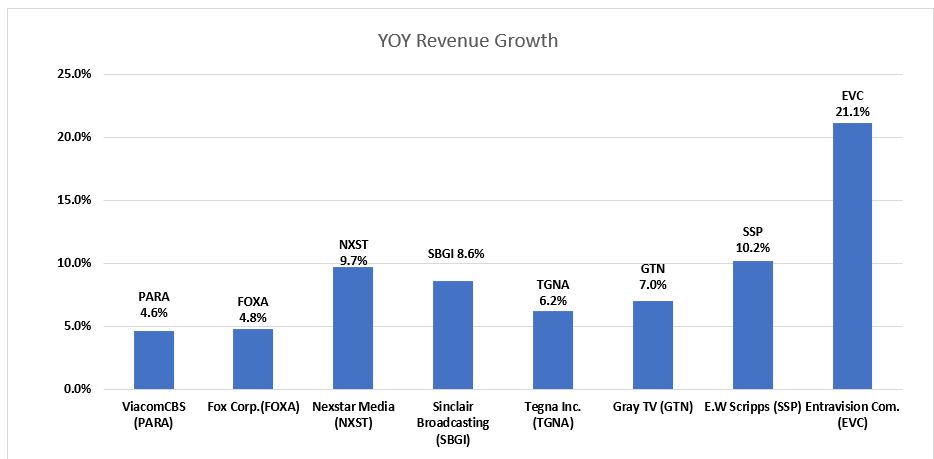
In our view, the current fundamentals may be better than the stocks project. Advertising seems to be holding up, post political advertising. As Figure #8 TV Q3 YoY Revenue Growth highlights, most companies in the industry reported strong Q3 revenue growth, influenced by a large influx of Political advertising. Figure #9 TV Q3 EBITDA Margins illustrates that the largest broadcasters, particularly Nexstar, has the largest EBITDA margins. Notably, the two stocks with the highest revenue growth in the quarter, Entravision and E.W. Scripps, performed the best in the fourth quarter, discussed later.
Notably, Local advertising appears to be fairing better than National advertising. Based on our estimates, core local advertising is expected to be down in the range of 5% to 8%, with core National down as much as the double digits. We believe that some large advertising categories like Auto, Retail and Home Improvement will show improving trends. The first quarter 2023 appears to be consistent with the fourth quarter. Smaller market TV likely will perform at the lower end of the range, while larger market TV will be at the higher end (greater core revenue decline). Broadcast Network is another story, which we believe is weak. Network has potential heightened competition.
Figure #8 TV Q3 YoY Revenue Growth
Source: Eikon and Company filings
Figure #9 TV Q3 EBITDA Margins
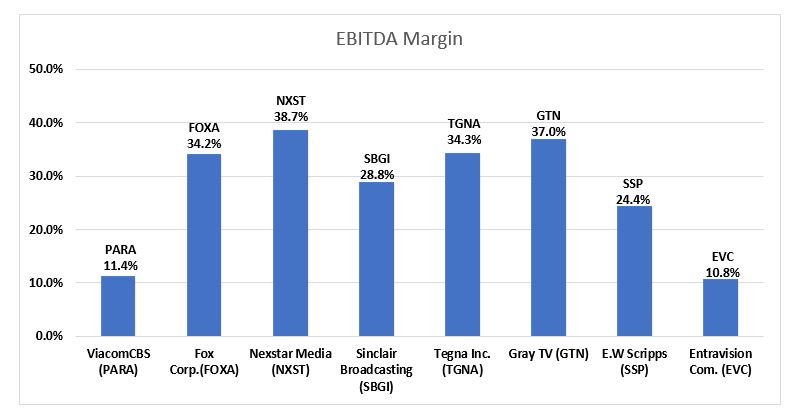
Source: Eikon and Company filings
As mentioned earlier, the Noble Television Broadcast Index declined 3.2% in the latest quarter, underperforming the general market’s 7.2% advance. Importantly, the 3.2% decline in valuations was a moderation from the 10.1% decline in the third quarter. There were variances in the performance and some notable performers including two of our favorites: E.W. Scripps, which increased 5.8% and Entravision, which increase 5.3%. Both of these companies were among the strongest revenue performers in the third quarter. Among the poor performers was Gray Television, down a significant 33.7% and Sinclair Broadcasting, down 24.0%. With the TV stocks down a significant 23.2% for the year, have the stocks already assumed that the industry is in an economic downturn? We believe that the stock may be oversold based on the prospect that advertising is currently holding up in the first quarter.
Is There Room For Upside?
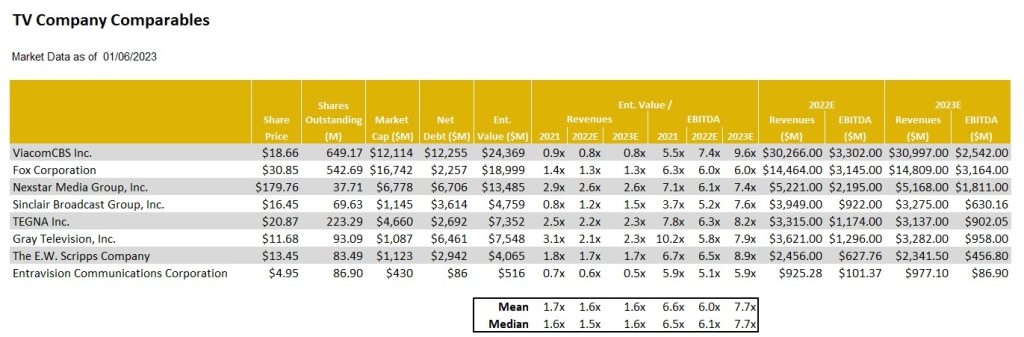
As Figure # 10 TV Industry Comparables highlight, most TV stocks are trading in a tight range of each other. The biggest variance in stock valuations is our current favorite Entravision, trading at 5.9 times EV to our 2023 EBITDA estimate, well below that of its industry peers which trade on average at 7.7 times. We believe that Entravision, which has migrated to become a leading Digital Media company which contributes roughly 80% of its total company revenues, should trade at a premium to its broadcast peers, rather than at a discount. Investors appear to be somewhat confused by the company’s relatively low EBITDA margins, which is a function of how revenues are accounted for in its Digital Media Division. We would also note that its financial profile is among the best in the industry, with a large cash position and modest net debt position of $86 million. As such, EVC leads our favorites in this sector.
Figure #10 TV Industry Comparables
Source: Eikon, Company filings and Nobles estimates
Radio Broadcast
Digital Is Bolstering Performance
The radio industry index was the worst performing index in the traditional media segment, declining 15.4% in the quarter and 63.8% for the year. The radio industry is feeling the pressure that recessionary concerns place on the demand for advertising. In addition to increased competition for audiences from digital music providers and shifting advertising dollars from radio to a more targeted advertising medium, digital media.
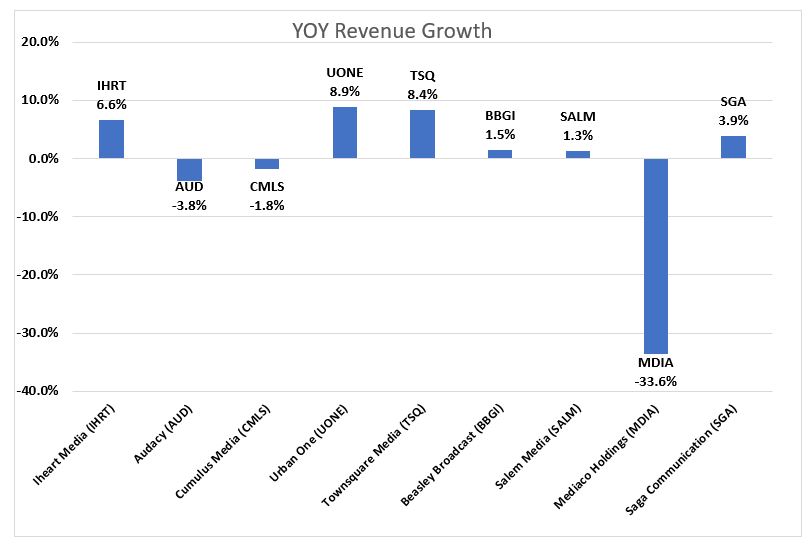
Figure #11 Radio Industry Q3 YoY Revenue Growth chart illustrates the year over year change in revenue for the third quarter. Urban One and Townsquare Media top their peers with revenue growth of 8.9% and 8.4%, respectively. A common theme with companies at the top of the list are diversified revenue streams. Salem Media and Beasley Broadcast Group are in the middle of the pack and are both taking steps to further diversify revenue. Salem has diversified into content creation and digital media and Beasley is continuing to pursue digital agency model. The median Q3 revenue growth rate was 1.5%, and the average revenue growth was -1%. The Average growth rate of -1% is skewed due to the poor performance of Medico holdings. In previous quarters Medico benefited from Covid-19 vaccine advertising campaigns and ticket sales for an annual outdoor live event that took place in Q3 of 2021. Without Covid vaccine advertising and Medico’s concert being held in Q2 2022 instead of Q3 resulted in revenue declining 33.6% on a year over year basis.
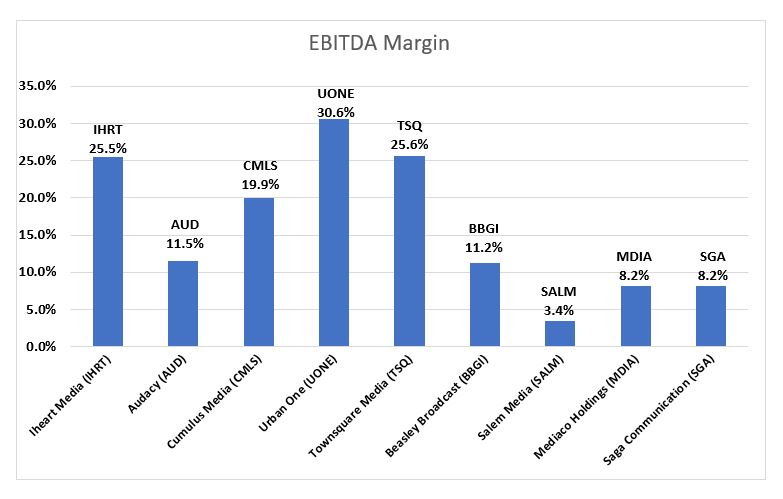
Industry adj. EBITDA margins were healthy, as Figure #12 Radio Industry Q3 EBITDA margins illustrates, Urban one, Townsquare Media and Iheart Media top the list with adj. EBITDA margins of 30.6%, 25.6% and 25.5%, respectively.
After the 2022 calendar year ended, Moody’s downgraded Cumulus Media’s Corporate Family Rating to B3 from B2. Moody’s believes Cumulus Media will face a further decline in advertising demand as the economy weakens. Moody’s could upgrade its rating if leverage decreases to 5x as a result of positive performance and could downgrade its rating if leverage ratio increases to 7x as a result of poor performance. It should be noted that Cumulus has a large cash position of $118 million and could access an additional $100 million through an asset backed loan.
However, there are several companies in the Radio industry with improving leverage profiles. Moreover, we believe that radio companies are diversifying traditional revenue streams with digital revenue. In our view, companies that achieved a greater degree of digital transformation and are better shielded from macroeconomic headwinds. Figure #13 Radio Industry Comparables highlights, Townsquare Media, Cumulus Media, and Salem Media are among the cheapest in the group. For those companies with substantial digital media businesses that are growing rapidly, like Townsquare Media and Beasley, we believe that advertising pacings in the first quarter are likely to be positive. On the low end pacings are expected to be flat to plus 3% and may even be stronger, up 8% or more in the second quarter (although this is too early to bank). In our view, advertising for these companies do not appear to be falling off of a cliff as the stocks seem to project. As such, we believe that the Radio sector appears to be in an oversold position and should have some upside prospects in 2023. Our favorites include TSQ, SALM, BBGI, and CMLS.
Figure #11 Radio Industry Q3 YoY Revenue Growth
Source: Eikon and Company filings
Figure #12 Radio Industry Q3 EBITDA Margins
Source: Eikon and Company filings
Figure #13 Radio Industry Comparables
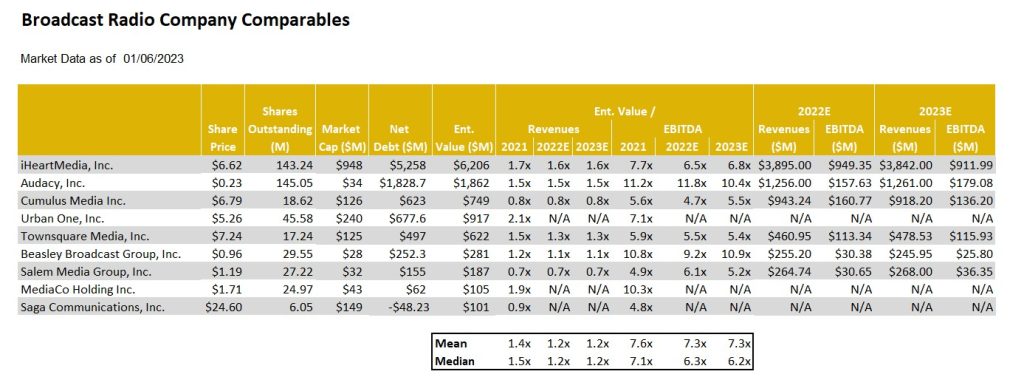
Source: Eikon, Company filings and Nobles estimates
Publishing
Illustrated above in Figure #6 Q4 Traditional Media Performance, the Publishing stocks had a pretty good quarter, up 17.9% as measured by the Noble Publishing Index versus the general market as measured by the S&P 500 Index up 7.1%. But the largest stocks in the index, New York Times and News Corp, were the only stocks that were up in the sector. Given that the Noble Publishing Index is market cap weighted, it was the reason that the Index was up in the quarter. Importantly, one of our favorites, Lee Enterprises was down a very modest 2.3% in the quarter. Again, the relatively favorable performance of the index was primarily due to its largest constituents, News Corp. and The New York Times, which rebounded from -29.7% and -39.1%, respectively in Q2, to -3% and +3%, respectively, in Q3 and then up 16.8% and 16.3%, respectively, in Q4.
We believe that Gannett, the nation’s largest newspaper company, continues to create a pall over the publishing group as it continues to struggle to manage cash flows with its heavy debt burden. In August, the company announced a round of lay offs of 400 employees and then announced another 200 in December. We believe that the company is trying to shore up its cash flow amidst a weak fundamental environment. Not surprisingly, the GCI shares were among the worse performers in the sector in the latest quarter, down 30%. To a large extent, the stock performance in the latest quarter reflected the various company results in Q3.
As Figure #14 Publishing Industry Q3 YoY Revenue Performance chart illustrates, Q3 publishing revenue declined on average 1.1%, which excludes the strong revenue growth of the Daily Journal. The company benefited from its Journal Technologies consulting fees which bolstered revenues in its fiscal Q4 results. In addition, during the year, the company sold marketable securities for roughly $80.6 million, realizing net gains of $14.2 million. As such, we have backed out the extraordinary results of the Daily Journal from our industry averages. Notably, Gannett had the weakest revenue performance in the latest quarter, down 10%.
The notable exceptions to the overall weak industry revenue performance was The New York Times, up 7.5% in Q3 revenues, which reflected a moderation in revenue growth from the prior quarter of an increase of 11.5%. News Corp, declined 1%, which was well below the 7.3% gain in the prior quarter. Importantly, Lee Enterprises fiscal quarter revenue was down a modest 0.2%, a sequential improvement from the modest 0.7% decrease in the prior fiscal quarter. We believe that Lee’s digital strategy continues to gain traction and that the company is very close to an inflection point toward revenue growth. We continue to note that Lee’s digital subscriptions currently lead the industry. The company has exceeded all of its peers in terms of digital subscription growth in the past 11 consecutive quarters. Furthermore, over 50% of its advertising is derived from digital. Currently, roughly 30% of the company total revenues are derived from Digital, still short of the 55% at The New York Times, but closing the gap.
Not only is Lee performing well on the Digital revenue front, it has industry leading margins. As Figure #15 Publishing Industry Q3 EBITDA Margins illustrates, Lee’s Q3 EBITDA margins were industry leading at 16.7%, again, excluding the extraordinary results at the Daily Journal which benefited from marketable securities trading. We believe that Lee’s margins are notable given that it demonstrates that the company is managing its margins in spite of the investments in its Digital Media businesses. Its margins place it on pare with its Digital Media focused peers, such as the New York Times.
As Figure #16 Publishing Industry Comparables chart illustrates, the LEE shares trade at an average industry multiple of 5.7 times Enterprise Value to our 2023 adj. EBITDA estimate. Notably, the company is closing the gap with its Digital Media revenue contribution to that of New York Times. The New York Times carries a significantly higher stock valuation, currently trading at an estimated 15.8 times EV to 2023 adj. EBITDA. We believe that the valuation gap with the New York Times should close. As such, we view the LEE shares as among our favorites in the industry.
Figure #14 Publishing Industry Q3 YoY Revenue Growth
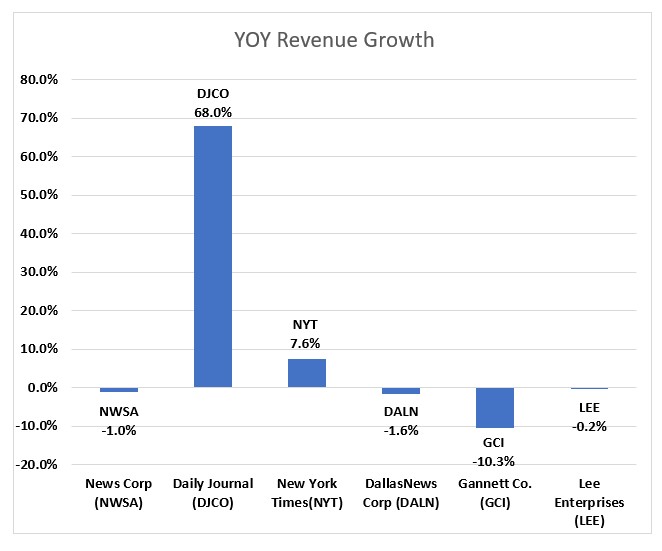
Source: Eikon and Company filings
Figure #15 Publishing Industry Q3 EBITDA Margins
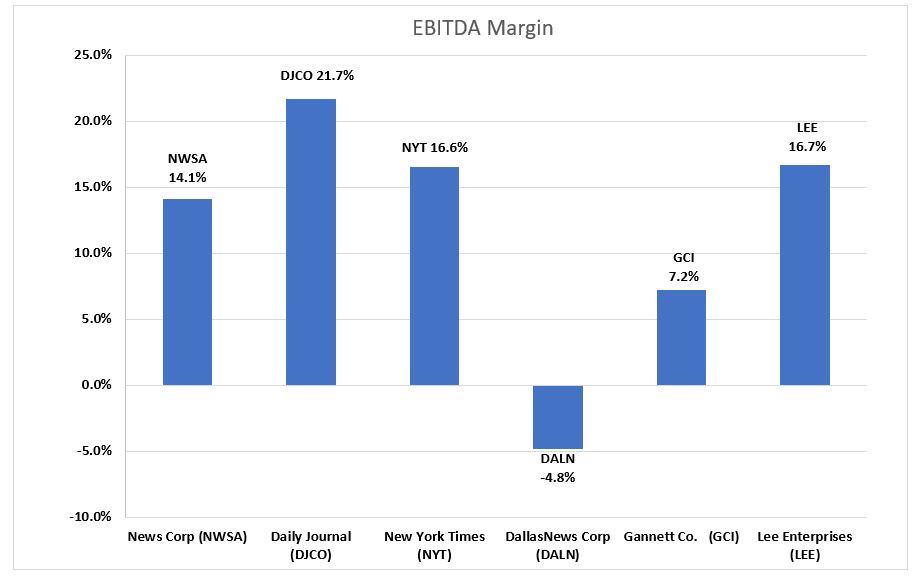
Source: Eikon and Company filings
Figure #16 Publishing Industry Comparables
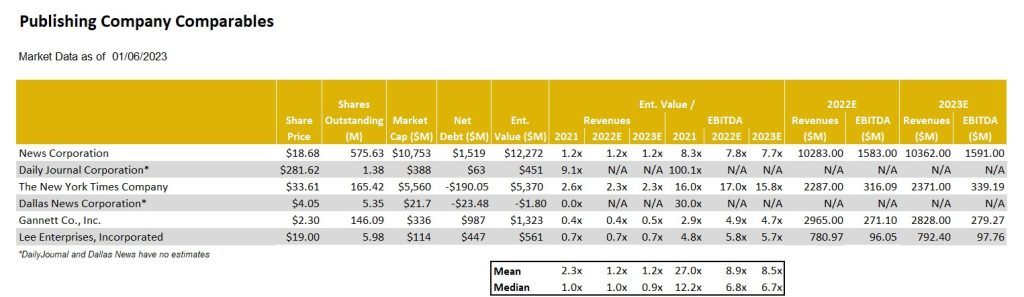
Source: Eikon, Company filings and Nobles estimates.
For additional disclosures and information on companies mentioned in this report, please click on the company name:
GENERAL DISCLAIMERS
All statements or opinions contained herein that include the words “we”, “us”, or “our” are solely the responsibility of Noble Capital Markets, Inc.(“Noble”) and do not necessarily reflect statements or opinions expressed by any person or party affiliated with the company mentioned in this report. Any opinions expressed herein are subject to change without notice. All information provided herein is based on public and non-public information believed to be accurate and reliable, but is not necessarily complete and cannot be guaranteed. No judgment is hereby expressed or should be implied as to the suitability of any security described herein for any specific investor or any specific investment portfolio. The decision to undertake any investment regarding the security mentioned herein should be made by each reader of this publication based on its own appraisal of the implications and risks of such decision.
This publication is intended for information purposes only and shall not constitute an offer to buy/sell or the solicitation of an offer to buy/sell any security mentioned in this report, nor shall there be any sale of the security herein in any state or domicile in which said offer, solicitation or sale would be unlawful prior to registration or qualification under the securities laws of any such state or domicile. This publication and all information, comments, statements or opinions contained or expressed herein are applicable only as of the date of this publication and subject to change without prior notice. Past performance is not indicative of future results. Noble accepts no liability for loss arising from the use of the material in this report, except that this exclusion of liability does not apply to the extent that such liability arises under specific statutes or regulations applicable to Noble. This report is not to be relied upon as a substitute for the exercising of independent judgement. Noble may have published, and may in the future publish, other research reports that are inconsistent with, and reach different conclusions from, the information provided in this report. Noble is under no obligation to bring to the attention of any recipient of this report, any past or future reports. Investors should only consider this report as single factor in making an investment decision.
IMPORTANT DISCLOSURES
This publication is confidential for the information of the addressee only and may not be reproduced in whole or in part, copies circulated, or discussed to another party, without the written consent of Noble Capital Markets, Inc. (“Noble”). Noble seeks to update its research as appropriate, but may be unable to do so based upon various regulatory constraints. Research reports are not published at regular intervals; publication times and dates are based upon the analyst’s judgement. Noble professionals including traders, salespeople and investment bankers may provide written or oral market commentary, or discuss trading strategies to Noble clients and the Noble proprietary trading desk that reflect opinions that are contrary to the opinions expressed in this research report.
The majority of companies that Noble follows are emerging growth companies. Securities in these companies involve a higher degree of risk and more volatility than the securities of more established companies. The securities discussed in Noble research reports may not be suitable for some investors and as such, investors must take extra care and make their own determination of the appropriateness of an investment based upon risk tolerance, investment objectives and financial status.
Company Specific Disclosures
The following disclosures relate to relationships between Noble and the company (the “Company”) covered by the Noble Research Division and referred to in this research report.
Noble is not a market maker in any of the companies mentioned in this report. Noble intends to seek compensation for investment banking services and non-investment banking services (securities and non-securities related) with any or all of the companies mentioned in this report within the next 3 months
ANALYST CREDENTIALS, PROFESSIONAL DESIGNATIONS, AND EXPERIENCE
Senior Equity Analyst focusing on Basic Materials & Mining. 20 years of experience in equity research. BA in Business Administration from Westminster College. MBA with a Finance concentration from the University of Missouri. MA in International Affairs from Washington University in St. Louis.
Named WSJ ‘Best on the Street’ Analyst and Forbes/StarMine’s “Best Brokerage Analyst.”
FINRA licenses 7, 24, 63, 87
WARNING
This report is intended to provide general securities advice, and does not purport to make any recommendation that any securities transaction is appropriate for any recipient particular investment objectives, financial situation or particular needs. Prior to making any investment decision, recipients should assess, or seek advice from their advisors, on whether any relevant part of this report is appropriate to their individual circumstances. If a recipient was referred to Noble Capital Markets, Inc. by an investment advisor, that advisor may receive a benefit in respect of
transactions effected on the recipients behalf, details of which will be available on request in regard to a transaction that involves a personalized securities recommendation. Additional risks associated with the security mentioned in this report that might impede achievement of the target can be found in its initial report issued by Noble Capital Markets, Inc.. This report may not be reproduced, distributed or published for any purpose unless authorized by Noble Capital Markets, Inc..
RESEARCH ANALYST CERTIFICATION
Independence Of View
All views expressed in this report accurately reflect my personal views about the subject securities or issuers.
Receipt of Compensation
No part of my compensation was, is, or will be directly or indirectly related to any specific recommendations or views expressed in the public
appearance and/or research report.
Ownership and Material Conflicts of Interest
Neither I nor anybody in my household has a financial interest in the securities of the subject company or any other company mentioned in this report.


