
Inflation for Americans at Each Age
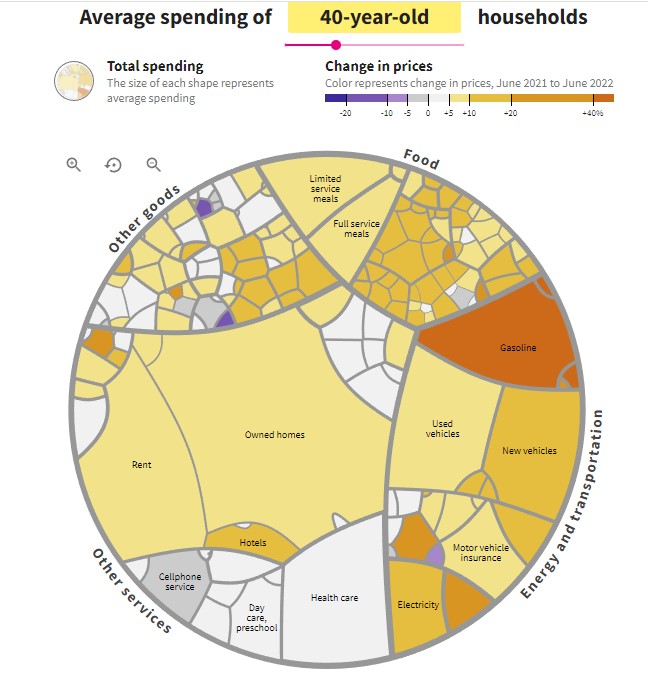
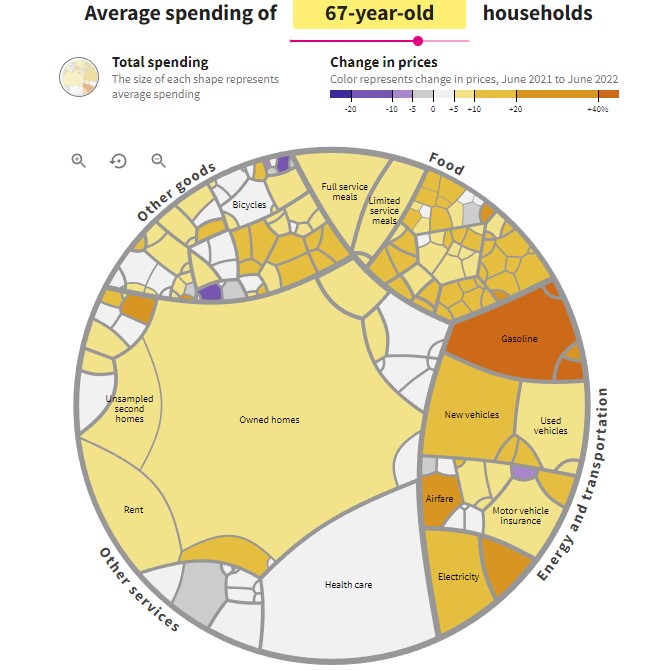
According to the Bureau of Labor Statistics, consumer prices rose 9.1% from June 2021 to June 2022, the highest rate since 1981. That figure is an average of price increases for bananas, electricity, haircuts, and more than 200 other categories of goods and services. But households in different age groups spend money differently, so inflation rates vary by age, too. The diagrams below show average spending for households at different ages, in the categories that make up the inflation index.
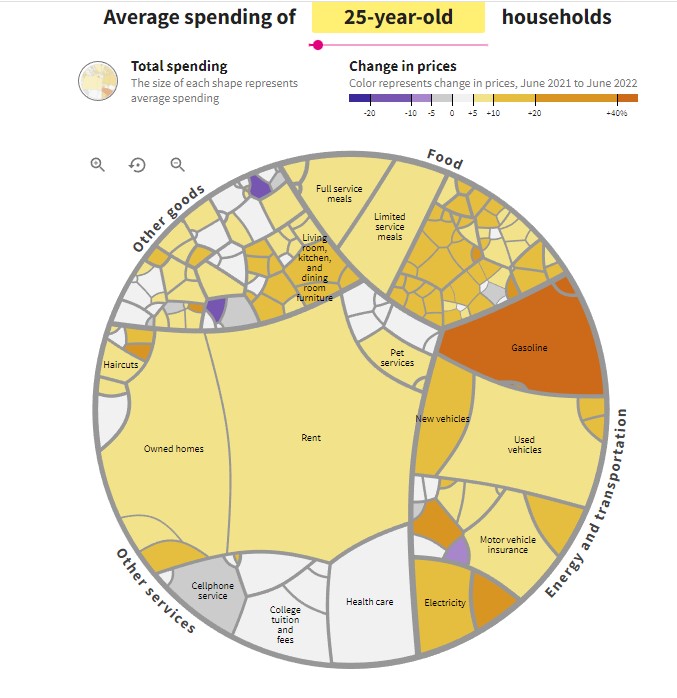
Young households spend more of their budgets on gasoline, where prices rose 60% in the last year. Gasoline has been the largest single-category driver of inflation since March 2021, accounting for nearly 25% of inflation by itself. Gas has had an outsized impact considering that the category is 4.8% of Consumer Price Index spending. (Gasoline prices began falling in mid-June.)
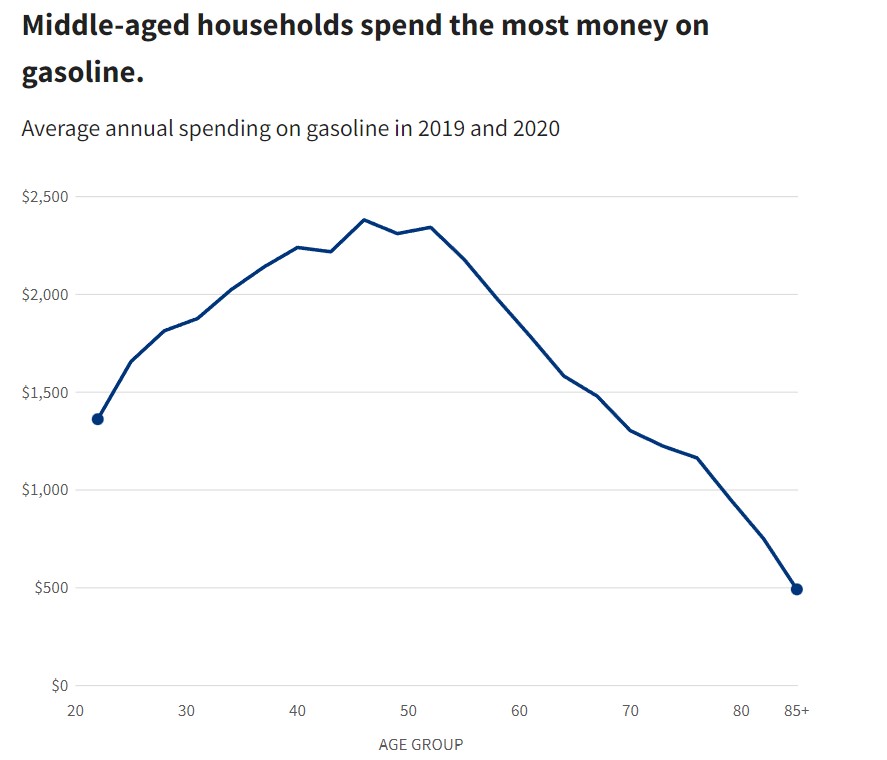
Measured in dollars, gasoline spending peaks around age 40, according to government surveys.
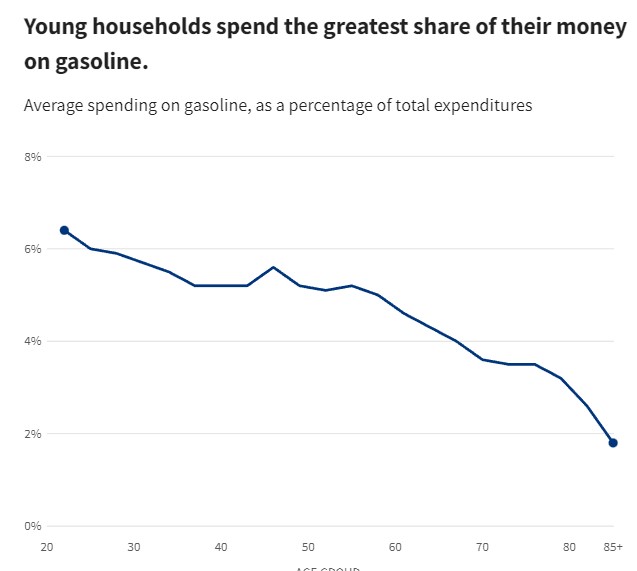
But, as a percentage of spending, gasoline spending is highest for the youngest households.
US Bureau of Labor Statistics
Consumer Expenditure Survey
Consumer Price Index
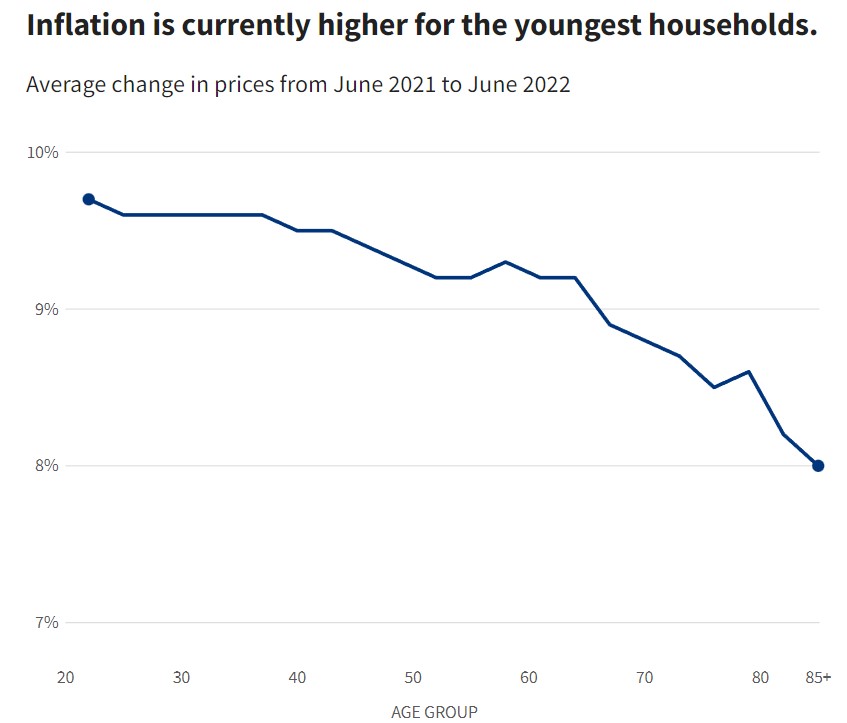
Taking an average of all categories, as the inflation index does, shows that inflation is currently highest for younger households. It is about 2 percentage points higher for households headed by 21-year-olds as it is for octogenarians who live at home. That has not been true for most of the last 40 years. Inflation rates calculated in this way were higher for older households as recently as early 2021, when medical care costs were rising faster than gasoline prices.
US Bureau of Labor Statistics
Consumer Expenditure Survey
Consumer Price Index
These estimates are imperfect. The Bureau of Labor Statistics notes in its estimate of inflation for elderly households that different age groups may buy different items within each category or buy them from different types of stores. They may also live in locations with costs of living so dissimilar that national changes in prices are not relevant. Over the past 12 months, inflation was 6.7% in the New York City metropolitan area and 12.3 in the Phoenix metropolitan area, due in part to different housing markets.
The above was adapted from USAFacts and is the intellectual property of USAFacts protected by copyrights and similar rights. USAFacts grants a license to use this Original Content under the Creative Commons Attribution-ShareAlike 4.0 (or higher) International Public License (the “CC BY-SA 4.0 License”).


