Tailwinds Causing Investors to Love the Small Cap Sector
Investors have been reeling in U.S. small-cap stocks, and many have experienced the market rewarding them. As the U.S. dollar has been unrelentingly strong in 2022, the cost of products in any other currency has increased, this makes sales more difficult for multinational companies. The lower sales, of course, have the impact of weighing on the profits of U.S. companies that derive a large part of their earnings from overseas trade. This puts the smaller stocks at an advantage.
U.S. Dollar Tailwind
Goods valued in dollars, for example, using The WSJ Dollar Index which measures a basket of 16 currencies against the U.S. currency, are now up 16% on the year. This represents the minimum increase of the cost of products sold after the foreign exchange transaction, before inflation.
This has little impact on small U.S.-based companies that don’t transact as much or at all outside the U.S. borders. This is because companies in the small-cap S&P 600 generate only 20% of their revenue outside the U.S., compared with large-cap S&P 500 stocks that generate 40% of sales internationally, according to FactSet.
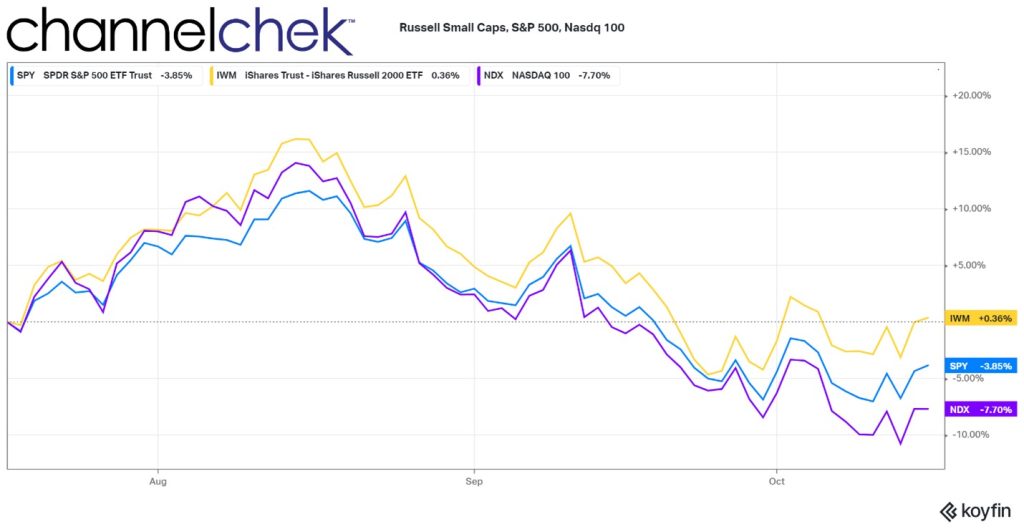
This by itself gives small-cap stocks, in the aggregate, an edge over large-cap indexes like the S&P 500. However, small-caps haven’t been unscathed by the overall negative market sentiment this year. But, in recent months, value investors have been putting more upward pressure on the smaller, more U.S.-centric companies than on companies in the Nasdaq 100 or S&P 500. In fact, the small-cap Russell index is the only one of the three indexes showing green over the past three months. It has also been outperforming in shorter periods like one month, 10 days, and 5 days.
Value Tailwind
Wall Street often uses the ratio of a company’s share price to its earnings (P/E ratio) as a gauge for whether a stock appears cheap or overpriced. The small-cap universe, by this measure, is very attractive relative to themselves in recent years and certainly relative to large-cap valuations now.
The S&P 600 is trading at 10.8 times expected earnings over the next 12 months, according to FactSet as of Friday. That is below its 20-year average of 15.5 and well below the S&P 500’s forward price/earnings ratio of 15.3.
The Russell Small-Cap 2000 is up .36% versus the S&P 500, down 3.85%, and Nasdaq 100, down 7.70%. Not shown on the graph below, the S&P 600 small cap index is flat on the period.

According to Royce Investment’s Third Quarter Chartbook, when comparing the stock market segments, four observations stand out. According to their Market Overview, these are:
1) Small-Cap Value, Small-Cap Core, and Small-Cap Growth are the cheapest segments of U.S. equities, 2) These segments are the only ones that are below their 25-year average valuation,
3) While all three value segments (Small-Cap, Mid-Cap, and Large-Cap) have nearly identical 25-year average valuations, their current valuations are vastly different, and
4) Mid-Cap Growth and Large-Cap valuations still have a long way to fall to reach their 25-year average valuations.
The presumption is with the segments all having the same 25-year average valuations and small-cap being below its average, while mid-cap and large-cap has to go down to reach its mean, that not only is small-cheap, but the other segments are still expensive.
Individually, some of the largest companies in the U.S. have shared their individual risks brought on by fluctuations in the currency market. Nike Inc., Fastenal Co., Domino’s Pizza Inc. and some others have pointed to negative foreign-exchange impacts during recent earnings calls. Microsoft warned of these pressures back in June.
Small-Cap Examples
Some standouts, not necessarily in either the S&P 600 or Russell 2000, small-cap indices, but found on Channelchek are, Bowlero (BOWL), with a market cap of 2.4 billion and performance of up 26.6% over the same three-month period shown in the chart above. For the same period, Comtech Telecommunications (CMTL), with a market cap of 281.5 million, and some international business, is up 12.6%. And RCI Hospitality Holdings (RICK), with a market cap of $705.9 million, has a three-month return of 45.7%. These examples can be found on Channelchek with complete, up-to-date research, alongside many other actionable opportunities.
Take Away
If yesterday’s trade isn’t working because of factors working against it, perhaps what wasn’t working yesterday is now coming into favor. The tailwind for smaller companies is coming from a few different places; they include having a higher percentage of domestic customers and also the law of reversion to the mean. The continued headwinds for larger companies include being much more likely to have problems that include foreign customer FX, and valuations that are still sitting above the 25-year average.
When researching small-cap stocks, remember that is exactly what no-cost Channelchek was made for.
Managing Editor, Channelchek
Sources
https://www.royceinvest.com/insights/chartbook/us-small-cap-mrkt-overview/index.html
https://www.wsj.com/podcasts/google-news-update/strong-dollar-boosts-bounceback-of-small-cap-stocks/