
Owning a Balanced Diversified Investment Portfolio Has Been Like Watching a Train Wreck
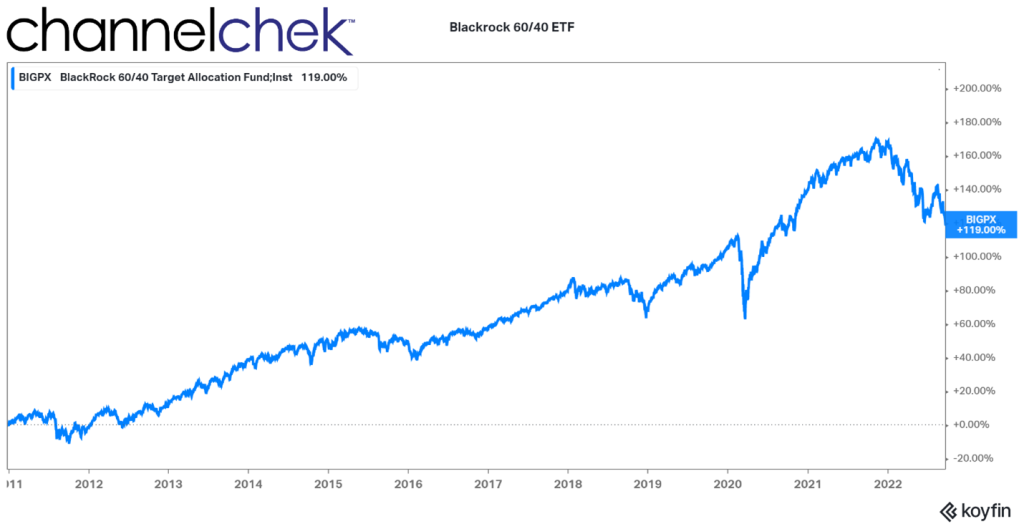
From the time that most realized the Fed would aggressively deal with inflation, watching the classic 60/40 balanced portfolio has been like watching a slow train wreck.
Diversification, balance, a 60/40 allocation have been the marching orders from those “in the know.” But what do you do when you’re terribly sure that the 40% in bonds will be worth less tomorrow, and the 60% in a standard stock index is more likely to be down than up? This is the question investors, wealth managers, and retirees have been faced with since early in 2022. The Chair of the Federal Reserve promised to raise rates, so the 40% allocation in bonds has been almost guaranteed by a Federal agency to perform worse than cash in your pillow case, and when interest rates rise, the economy does worse, which at first weighs down stock indexes.
Advisors want their customers to sleep better at night, so they tell them not to worry, no one can call the market, you don’t want to miss the up days. Every time, the markets have bailed them out, and there is no reason not to think that there won’t continue to be eventual increases on one side or the other of the investment pie chart. Meanwhile, missing predictable down periods are just as important to exceptional long-term results as being invested when values rise.
60/40 101
The classic portfolio of 60% stocks and 40% bonds touted in articles by wealth managers and certified by textbooks on investing may no longer provide the same level of returns that it delivered previously. Or it may be going through a period where the direction of stocks and bonds is highly correlated – and it will at some point turn the corner to balanced performance.
From the 1980s until recently, a portfolio of 60% stocks and 40% bonds did well for investors and for good reason. The mix consistently provided investors with attractive risk-adjusted returns, with total returns often equal to or better than those of the S&P 500 Index and with lower volatility. In a more natural market, rates come down (bond bull market) when the economy is weak, which brings stock prices down (stock bear market) and visa versa. The investor always has positions in a bull market to partially offset losses from the other side of the portfolio.
Recent History of Balanced Portfolios
But this strategy hasn’t really worked for decades. Many haven’t noticed because its not working has benefitted investors. Debt and equity prices have moved in the same direction. Both stocks and bonds have reached new highs through last year. Investors aren’t critical when they’re making money, but both markets joined hands long ago and have been mostly moving in the same direction. Here’s your evidence; in 1982, a 30 year-treasury bond was issued, paying over 14%. Today the 30-year is paying 3.65%. So the bond market, with slight ups and downs, has been strong for most of the last 40 years. The S&P 500 in 1982 closed at 120. Today, the same index is at 3,675. Both markets, although not always trading hand in hand, more often than not rise and fall together.
60/40 in 2022
The protection of hiding behind a broad, diversified index of stocks and conservative (supposedly uncorrelated) bonds is certainly showing its weakness this year. Persistent structural inflation adding to interest rates and negative GDP growth have battered both markets. It exposes that 60/40 is not perfect and that set-it and forget-it could cause many to have large drawdowns that will require huge percentage increases in the future.
What to Do
When the most powerful mover of assets transparently says they are going to do something that will impact the markets, believe that the odds are that they will. In other words, don’t fight the Fed. This could mean a slight to a total reduction in bonds, why watch your bond portfolio become a train wreck. And if you are in bond funds, a move to individual bonds offers the solace of at least knowing they mature at par.
The stock portfolio is trickier. The equities market will turn around when there are signs that the economy has bottomed out. Currently, there are some signs of weakness, but mostly expectations of great weakness as we know the Fed is resolved to tame inflation. Investors will race to be first in on the most recent dip. Selectively picking stocks that have a good reason to outperform now and be strong later when bullishness returns is likely smarter than holding a broad-based index. The broad-based economy is headed lower, so it stands to reason the broad-based indexes have further to fall.
Don’t be a stranger to analysts’ reports on individual companies. Expert, unbiased analysis of sectors and individual stocks can help you uncover those that are unlinked to negative world events or are taking advantage of global changes.
Cash was trash when rates were near zero. Currently, a three-month T-Bill yields around 3.75%. Other short and safe securities are closer to 4%. When there is a recognizable turnaround, you’ll want ammunition. Keep some dry powder to be able to pounce; today’s short interest rates provide returns above those expected in the major indexes. Check with your broker to find out how to invest in short-term agencies, T-Bills, or broker CDs so you are ready for when the Fed says they are in a wait-and-see mode, for when GDP shows we are clearly not in a recession, for when corporate earnings are on the rise, and for when interest rates on bonds are closer to a level that produces low inflation numbers.
Take Away
Stocks and bonds have mostly been moving in the same direction for a very long time. Both were moving up, so no one noticed.
Cash is also an option in any portfolio, and you’re now getting paid more. If the Fed continues to suggest rates are rising, it practically ensures lower bond prices. Move to cash or carefully selected equities. Look for quality analysis of sectors and stocks before jumping into a stock. News stories, statistics, and often research and analysis on small-cap opportunities are available for those signed-up for Channelchek emails, along with many other no-cost perks.
Managing Editor, Channelchek
Sources


