To Show Banks at Risk, Michael Burry’s Picture Equals 1000 Words
Michael Burry has a well-deserved reputation for foreseeing approaching crises and positioning his hedge funds to benefit client investors. While he’s most famous for his unique windfall leading to and after the mortgage crisis of 2008-2009, the current banking debacle has him tweeting thoughts most days. His most recent bank-related tweet is worth sharing and, for most investors, needs some explaining.
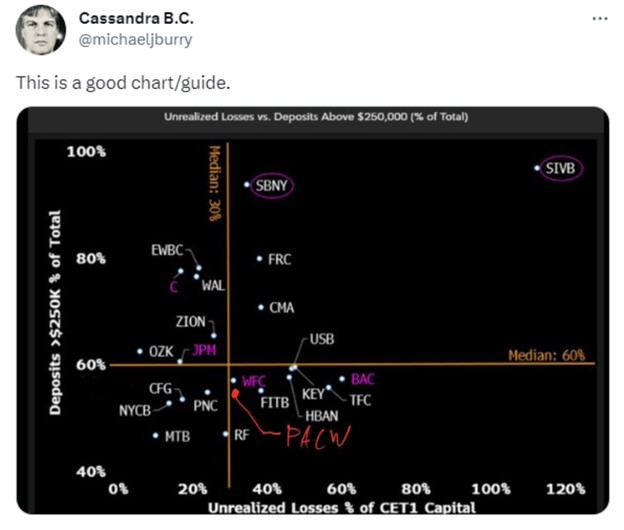
Recently Burry posted a chart of some large banks and their insured deposit base relative to their Tier 1 capital.
Common Equity Tier 1 Capital (CET1)
To best understand this chart it helps to be aware that for U.S. banks, the definition of Tier 1 capital is set by regulators. It’s an apples to apples measure of a banks’ financial strength and easily used to compare bank peers. Overall it is the bank’s core capital, and helps to understand how well the banks financial infrastructure can absorb losses. It includes equity and retained earnings, as well as certain other qualifying financial instruments.
Unrealized Bank Losses
The sub-prime banking crisis of 2008 is different than what banks are struggling with now. The problem then was created by lax lending practices, including liar loans, floating rate mortgages with teaser rates, significant house flipping using these introductory (teaser) first year rates, and repackaging and selling the debt – often to other banks.
The current issue facing banks today is the prolonged period of rates being held down by monetary policy. Low rates makes for easy money and economic growth, but there is eventually a cost. The cost is overstimulus and inflation, then what is needed to fight inflation, in other words, higher rates.
Higher rates hurt banks in a number of ways. The most calculable is the value of their asssets, including publicly traded fixed rate obligations (Treasuries, MBS, municipal bonds, corporate bonds, other bank marketable CDs) all decline in worth when rates rise. The other way banks get hurt is that loans extend out when rates rise by a significant amount. As a bank customer, this is easy to understand, if you took out a 30-year mortgage two years ago, your rate is between 2.75%-3.50%. If mortgage rates move, as they did to 7%, the prepayment speeds on the loans extend out farther. That is to say fewer borrowers are going to add more to their principal payment each month, and those that may have bought another residence by selling the first and paying the loan off, are staying put. The banks had assigned a historic expected prepayment speed to each loan that represents their region, and the low rate loans are now going to take much longer to repay.
FDIC Insurance
Michael Burry (on assets as described above) used his Bloomberg to chart large bank unrealized losses to the potential for depositors to remove their uninsured deposits. Currently the FDIC is only obligated to insure bank deposits up to $250,000. Customers with deposits in excess of this amount (depending on how registered) leave their excess money at a single bank at their own risk.
It would seem logical for large customers and small, in this environment to check their own risk and bring it to zero.
The Wisdom of the Chart
The further up and to the right banks are on the chart, the more at risk the bank can be considered. This is because uninsured deposits equal more than 60% of liabilities, so prudent customers would move someplace where they are better protected.
However, if depositors do move money out of the banks listed here, the bank would have to either find new deposits, or stand to lose 30% or more by selling assets that are underwater because of rising rates. The banks are currently not easily able to go out into the market and attract money. Partially because we are now in a climate where even basic T-Bill levels would be high for a bank to pay, but also because there is less money supply (M2) in the system.
Take Away
Michael Burry is a worth paying attention to. His communication is often through Twitter, and his tweets are often cryptic without context. His most recent set of tweets, including one commenting on the chart outlines what is happening with a number of banks that find themselves in the unenviable position of ignoring the Fed’s forward guidance on rates and very public inflation data.
Sign-up for free stories daily from Channelchek, along with research and a full calendar of investor events. Sign up here.
Managing Editor, Channelchek
Sources
Cassandra B.C. on Twitter


