
The US Budget Office Just Laid Out its Ten-Year Forecast – What Investors Should Know
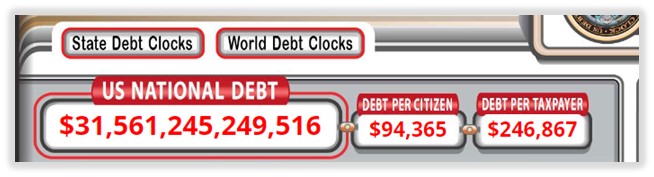
The US National Debt Clock app might be useful for those that suffer from low blood pressure. I’m being facetious – the app and website provide a visual of the current estimated overall national debt. It breaks out what each citizen’s theoretical share is, and then divides it up in dozens f other categories. The clock is an estimate of real-time. For a future projection, the better place to turn is the just-released forecast from the Congressional Budget Office (CBO). The CBO’s website can be insightful and idea-provoking for investors as it includes a 10-year forecast for government spending, which is broken down by industry type.
Direction of Overall US Debt
The US is on track to accumulate more than $19 trillion in additional debt over the next decade, according to a CBO document released on February 15.
This new expectation is $3 trillion more than previously forecast. Coming at a time when there is headbutting and chest pounding going on in Washington surrounding the debt ceiling (US Treasury borrowing cap), the significantly larger 10-year budget may additionally stress the governments ability to pay its bills. Phillip Swagel, a director at the CBO expressed his concern saying, “The warning is that the fiscal trajectory is unsustainable.”
The federal government is expected to collect $65 trillion in revenue over the next ten years. More than half is expected to come from individual income taxes, and another third comes from payroll taxes. Individually, we can’t change what may be higher taxes, or a weakened government financial situation, which, separate from the Federal Reserve, puts upward pressure on interest rate levels.

Drilling down deeper into where the funding is expected to flow from, individual income taxes are planned to remain level through 2025, then ramp up at a pace quicker than payroll taxes and corporate taxes.
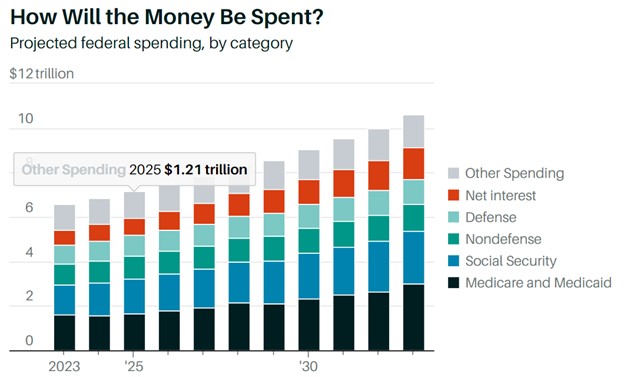
But the country will spend much more than what it collects. Rising interest payments, large federal stimulus bills, and the growing costs of Social Security and Medicare benefits for retiring baby boomers are some of the government’s largest spending items.
Of the Federal agencies budgeted to spend the highest amount, health and human services top the list. Small percentage increases are a lot in actual dollar amounts when trillions are involved. Social Security is the agency consuming the second most amount, followed by the Treasury, which is experiencing growing interest expenses.
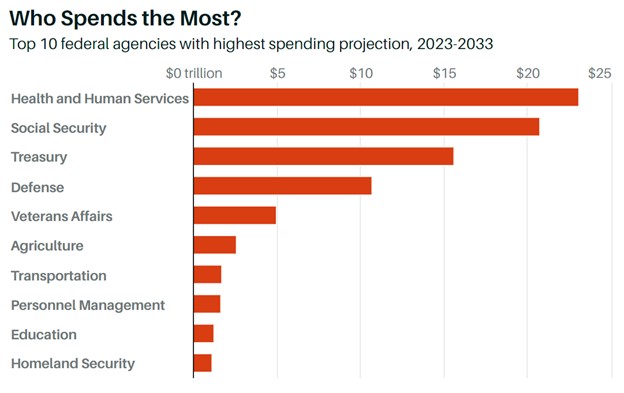
Looking at a broader swath of areas that should benefit as a result of government budget expansion, we see in the graph above the top three areas already mentioned, followed by at least a trillion spent over ten years in defense, veterans affairs, agriculture, transportation, personnel, education, and homeland security.
For Investors to Think About
Short-term investors tend to ignore some approaching realities while overly focusing on others. Long-term, investors may find that the cost and expansion of public debt will eventually have the US responsible to pay more in interest over the next decade. By 2033, the net interest on public debt is expected to make up 14% of the federal government’s total spending.
There was another period in US history when net interest made up such a large slice of Federal spending, this was in the mid-to-late 1980s. Eventually, Congress did pay some attention to deficit reduction; it took years to taper the growth. The resurgence of the expanding debt trend in recent years has been explosive.
Interest rates on bonds could have built upward pressure as more debt would need to be issued to refinance at higher rates and pay for additional spending. A greater supply of debt without a growing supply of buyers is a recipe for higher bond yields. Are higher yields attractive? In bond markets, the value of a fixed bond goes down when rates rise. Floating rate bonds tend to approximate par throughout their life, but the Treasury and Wall Street have not been quick to issue these in the face of rising coupon rates.
Stock market investors may find value in investing in companies that receive 25% or more of their revenue from government contracts, particularly those agencies on the chart above that are budgeted to grow by billions or trillions. This could include smaller companies where the impact is greater. Within this category are aerospace contractors like Kratos (KTOS), communications companies like Comtech (CMTL), or transportation-related spending that could benefit dredging from companies like Great Lakes Dredge and Dock (GLDD).
The smaller companies mentioned may benefit from the massive budget growth. But they are not alone, Channelchek is a great source of data and discovery of many companies doing great things that are destined to become even greater. Be sure to sign-up for all the free resources available to investors by going here.
Managing Editor, Channelchek
Sources
https://www.cbo.gov/publication/58848
https://www.cbo.gov/data/budget-economic-data#11
https://www.cbo.gov/data/estimate-presidents-budget-proposals


